The Age-structural Transition
The status of the global age-structural transition, 2015 Continue Reading →


![]() This website is dedicated to political demography, and to The Age-structural Theory of State Behavior (download article here). Read "The 8 Rules" for a quick summary of the theory. See sidebar (homepage) for key publications and web essays. Please follow the development of this research on Twitter at @rpCincotta or visit the New Security Beat.
This website is dedicated to political demography, and to The Age-structural Theory of State Behavior (download article here). Read "The 8 Rules" for a quick summary of the theory. See sidebar (homepage) for key publications and web essays. Please follow the development of this research on Twitter at @rpCincotta or visit the New Security Beat.
Youthful Clusters
 Have you ever noticed that shifts in the world political order are clustered in time and geographical location? For example, the late-1980s and 1990s, economists and political scientists were caught off guard by the economic rise and a series of political reforms among the East Asian Tigers (South Korea, Taiwan, Thailand, Singapore, and Indonesia), quickly setting them apart from the rest of the developing world. The Tigers’ successes were followed in the early 2000s by an unheralded burst of liberal democracy among Caribbean and Latin American states (including Brazil, Chile, Argentina, Guyana, Trinidad & Tobago). Then, beginning in 2010, came the Arab Spring, during which Tunisia’s attainment of liberal democracy caught regional political experts completely off guard.
However, demographers were less surprised (see 2008/09 article predicting the rise of a democracy in North Africa). The states of these regions were entering the demographic window–a period during the age-structural transition when states typically progress economically and often undergo political changes.
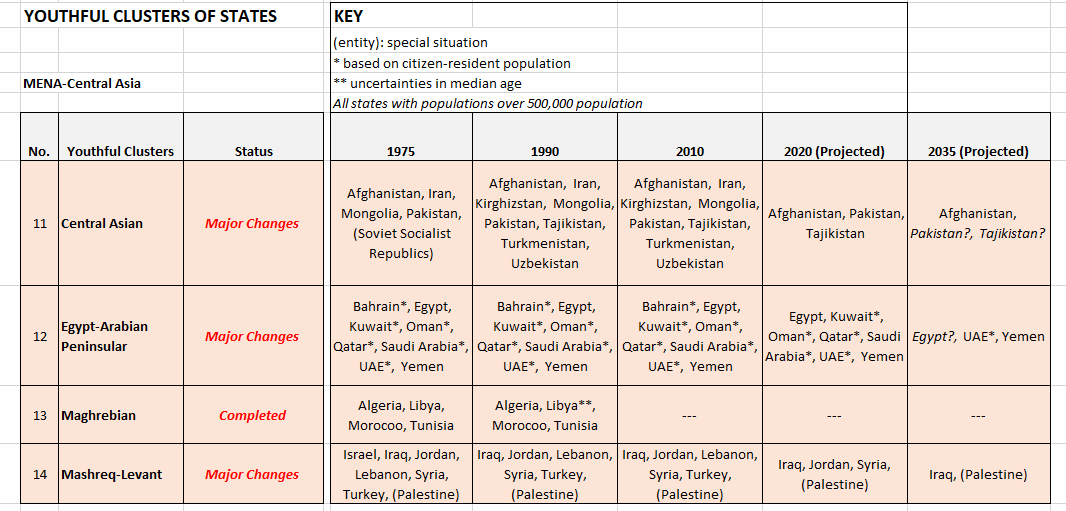
Similar temporal and geographical clustering arises where progress in the age-structural transition has not occurred; i.e., among youthful clusters of states that are “stuck in age-structural time.” Today, the vast majority of revolutionary conflicts (insurgencies that are focused on overthrowing the political system or altering the central government, as indicated in the latest (2017) version of the UCDP/PRIO Armed Conflict Data Set) occur in youthful states—those with a median age at or below 25.5 years. Youthful states typically appear in clusters, and these conflicts tend to spread across their borders, typically stopping at the borders of non-youthful states.
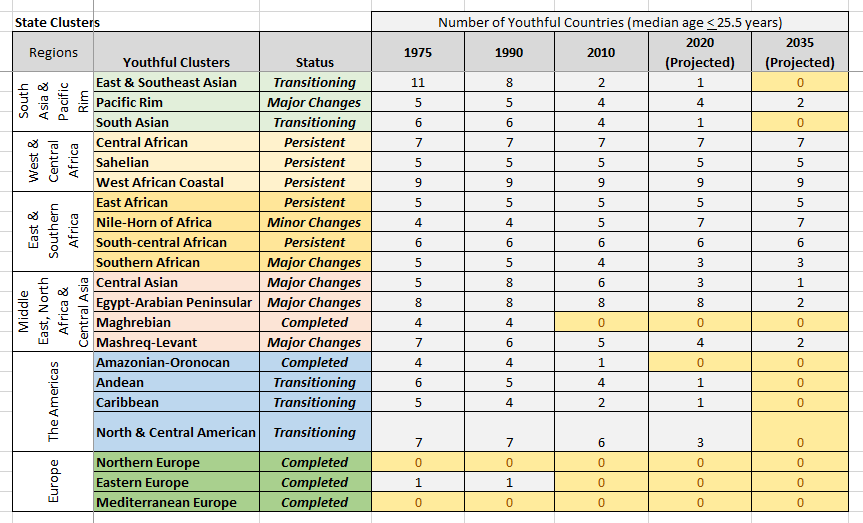
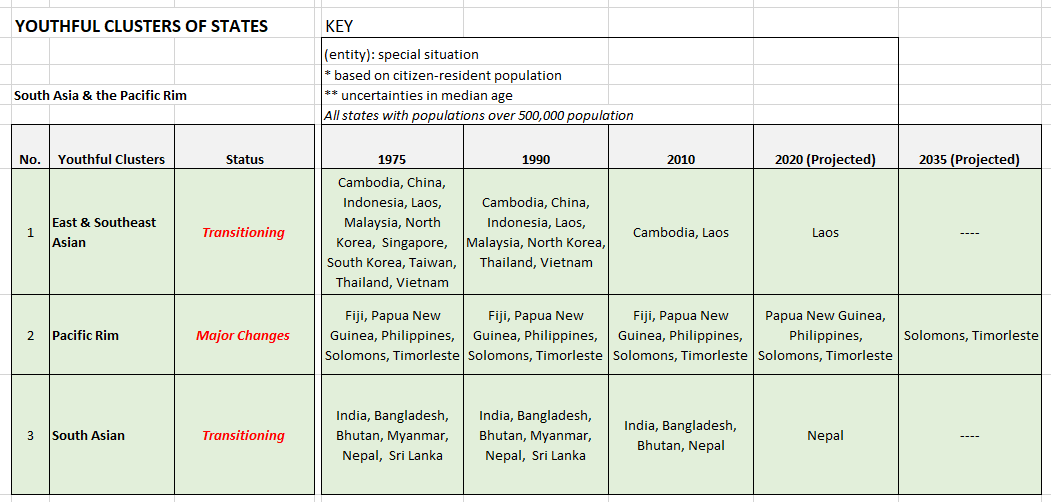
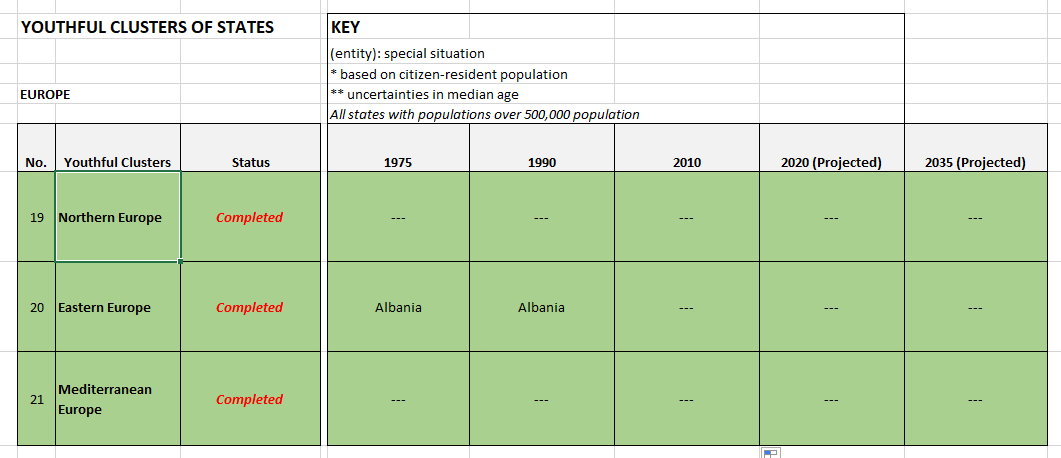
In the following 6 regional tables (South Asia & the Pacific Rim; West & Central Africa; East & Southern Africa; the Middle East, North Africa & Central Asia; the Americas; and Europe), I’ve divided the world into 21 clusters of states. In 1975, 18 of those clusters were dominated by youthful states–countries with a median age of 25.5 years or less.
A lot has transpired since then. I track the cluster to 1990, and 2020 (a very short-term projection), and finally a projection to 2035 (using the UN Population Division’s medium fertility variant). As the years progress, states experiencing fertility decline advance to the next phase of the age-structural transition (the intermediate phase, between a median age of 25.6 and 35.5 years). These drop out of the cluster until, as in 3 cases, the youthful cluster disappears (see Table 1, below).
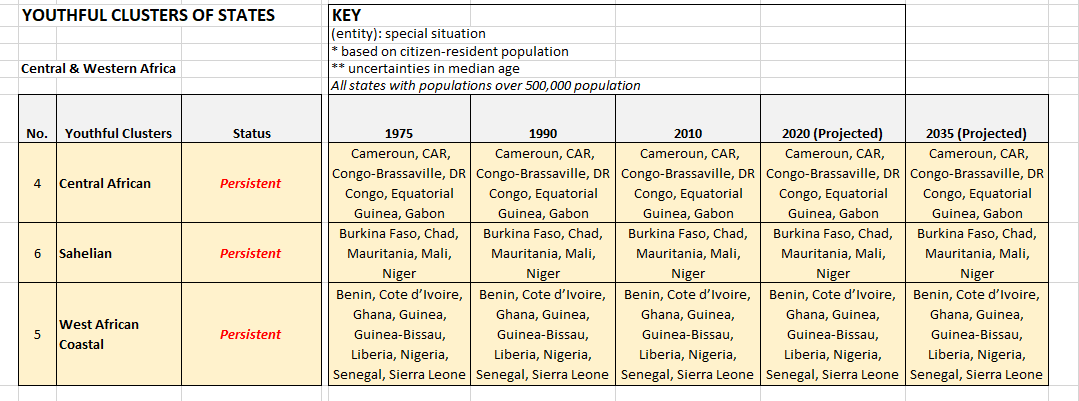
However, 16 clusters still remain. Four situated along the midriff of Africa (West Africa Coastal Cluster, the Sahelian Cluster, Central African Cluster, and South Central African Cluster), within the tropics, persist just as they did over 40 years ago. These are Western and Central African clusters likely to be significant sources of revolutionary conflict and other forms of political instability throughout the rest of the century. Another 7 clusters (in the Middle East, other parts of Asia, and Africa) have gone through minor and major changes also generate ongoing as well as future risks. However, according to the UN Population Division’s demographic projections, these may gradually fade over the coming three decades.
The final 5 clusters of states are “in transition.” The states in these groups are experiencing fertility decline and shifting to the intermediate phase of that age-structural transition. These youthful clusters may disappear over the coming two decades.


 This article is part of the World Economic Forum’s Geostrategy platform
Last year, 2018, marked the 60th anniversary of a landmark publication by a pair of academic social scientists who first recognized the close relationship between population age structure (the distribution of a country’s population, by age) and development, writes Richard Cincotta in the Wilson Center’s New Security Beat, Does demographic change set the pace of development? [to read full article, click here on MORE]
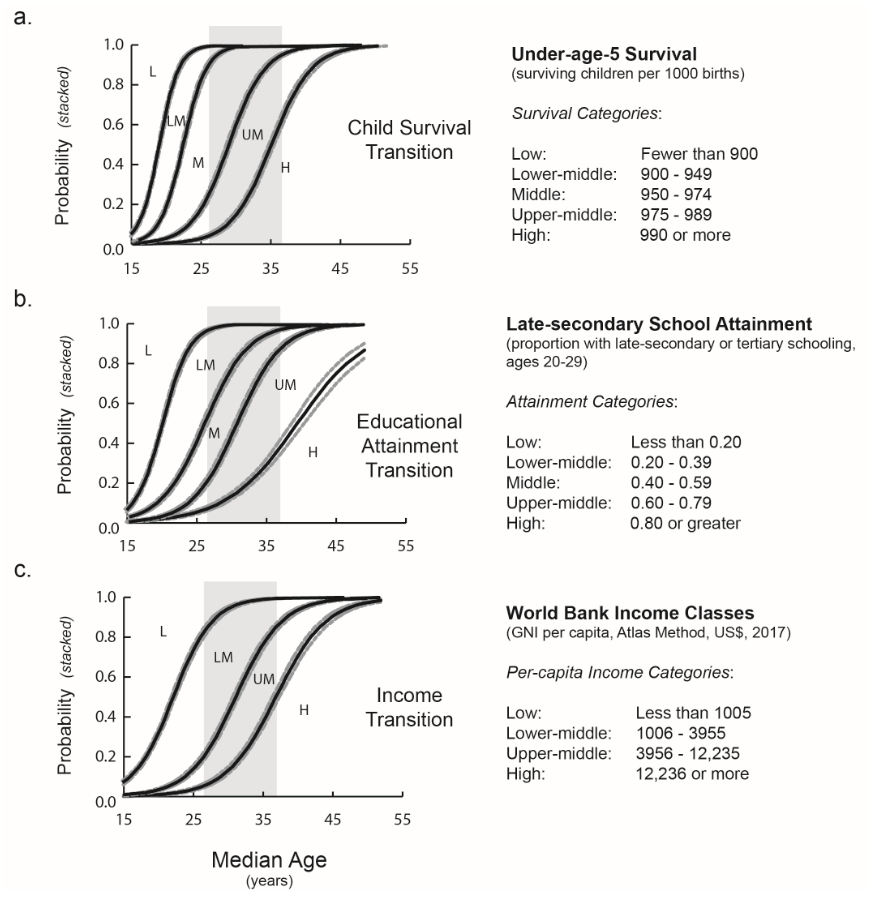
[Graph on left] The statistical method used to produce the age-structural timelines (logistic regression) shown here, works with categorical data, rather than individual data points. So, to show the pace of development on age-structural timelines, each of the three basic transitions—child survival, educational attainment, and income—are divided into a series of consecutive categories.
For example, the income transition (c., bottom graph) is represented by the World Bank’s low, lower-medium, upper-medium, and high-income categories. Similarly, the child survival transition (a.) is divided into five survival categories, and the educational attainment transition (b.) into five attainment categories.
Unlike historic timelines, each age-structural timeline is spanned by a series of curves. Each curve shows when—in terms of median age—countries are likely to achieve that category. The next curve (to the right in the series) shows how rapidly, in terms of progress in median age, countries are likely to move into the next higher category.
![]()
Original Essay: Does Demographic Change Set the Pace of Development?
Comment: Jane O’Sullivan, U. Queensland.
A good title but a disappointing treatment. In the context of the fertility transition, age structure and population growth rate are confounded. There is little evidence that age structure per se delivers these benefits – it is the slowing of population growth that affects “demand side”. Of course, age structure affects specifically which areas of demand are first affected, but that’s not what matters. The problem is that the “demographic dividend” discourse is used as a means to not have to talk about population growth, but in doing this, it undermines the motivation to get fertility down below replacement-level, which is the urgent need. Indeed, by fuelling the “aging crisis” myth, the DD message actively discourages efforts to complete the transition to low fertility. Also, the role of family planning programs is missing from the flow diagram. Education, income and child survival don’t have strong effects on fertility without explicit behaviour-change programs. [Note: see Dr. O’Sullivan’s research on population impacts, demographic ageing, food security, and climate change issues]
Reply: Richard Cincotta, Woodrow Wilson Center/Stimson Center
Thank you for your interesting comments, Dr. O’Sullivan. And, welcome to the growing ranks of the disappointed.
The curves featured in this essay were developed as part of the (U.S.) National Intelligence Council’s (NIC) long-range effort (the Global Trends series of publications) solely for the purpose of forecasting changes in political, social, and economic indicators from 2 to 20 years into the future.
For forecasting, the method has worked surprisingly well (you can read some of its forecasts in my other NSB posts). Analysts have used the method’s “eight rules of political demography” (also on NSB) to successfully forecast the rise of a liberal democracy in North Africa two years before the Arab Spring, to identify the remaining clusters of countries most at risk of intra-state conflicts, and to predict declines from liberal democracy among youthful countries.
Along the way, however, its findings have disappointed (or even angered) diplomats, advocates, and political scientists who have deeply-held views of how the world works.
One source of disappointment has to do with population growth. While states with a population under 5 million (particularly small island states) do, indeed, appear to develop politically and socioeconomically more quickly than expected, we have found no additional statistical evidence suggesting that larger population sizes or densities are—so far, at least—a “net impediment” to political and socio-economic development.
For example, population size and density may depress economic productivity by limiting per-capita freshwater supplies, exacerbating pollution, and forcing agriculture into marginally productive land. At the same time, however, population growth drives urbanization, which positively affects per-capita income and speeds other development transitions (including fertility decline).
My own experience with assessing population’s influence leads me to conclude that, in general, increasing human density disrupts and alters natural ecosystem processes (i.e., nature). Unfavorable age structures disrupt development processes (i.e., the state). States are, indeed, affected by ecosystem disruption, but our species has become very good at making and remaking its own highly productive ecosystems—most of which create additional long-term disruption (e.g., climate change, species loss, high nitrogen loading in soils, etc.–a point that you know well from your own research).
As for your critique of Fig. 3: I have indicated (in the diagram) that income and child survival’s effects on fertility are (as you suggest) weak or highly variable. However, I believe that most development analysts would disagree with your assessment of education’s impact on fertility—particularly the impact of women’s educational attainment, which in the past has been statistically strong. Nonetheless (consistent with your assertion), the effect of women’s educational attainment on fertility in tropical sub-Saharan African countries seems, so far, to be weaker than expected (when compared to the Asian and Latin American fertility transitions).
While you insist that getting fertility “down below replacement-level” is an urgent need, our analysis differs somewhat. To achieve a median age of 26 years—the beginning of the demographic window—fertility must decline below 2.8 children per woman. However, continued progress toward a median age of 30 years has generally led to additional fertility decline to near-replacement (close to TFR 2.1) or below-replacement levels.
On population aging: A myth? Perhaps you are referring to the mistaken beliefs/rhetoric of some political leaders of tropical African states who fear an aging population—seemingly unaware that the current UN Medium Fertility Variant scenario projects that such large proportions of elderly, for most tropical African states, will likely show up on the far side of 2100 (probably a century into the future). I believe that, to achieve a median age of 26 years, the leadership of those states must be prepared to dismantle the traditional and religious constraints on women’s lives (much like Habib Bourguiba did shortly following Tunisia’s independence), in addition to supporting quality family planning programs, girls’ education, and elevating women into positions of political power.
However, for the group of very low fertility European and East Asian countries that are rapidly advancing into the post-mature phase of the transition (median age 46+ years), the challenges of population aging are hardly mythical. Does population aging qualify as a crisis for economic and political liberalism? No one knows. However, the most credible research foresees substantial fiscal strains on retirement and healthcare systems (see Lee & Mason’s National Transfer Accounts review), and the admixture of population aging and immigration seems (to me, at least) to be yielding some unfavorable political byproducts.
Thanks again for your comments, Dr. O’Sullivan. // Richard Cincotta
![]() This year, 2018, marks the 60th anniversary of a landmark publication by a pair of academic social scientists who first recognized the close relationship between population age structure (the distribution of a country’s population, by age) and development. In Population Growth and Development in Low Income Countries (Princeton U. Press, 1958), demographer Ansley Coale (1917-2002) and economist Edgar M. Hoover (1907-1992) theorized that eventual declines in fertility would transform developing-
This year, 2018, marks the 60th anniversary of a landmark publication by a pair of academic social scientists who first recognized the close relationship between population age structure (the distribution of a country’s population, by age) and development. In Population Growth and Development in Low Income Countries (Princeton U. Press, 1958), demographer Ansley Coale (1917-2002) and economist Edgar M. Hoover (1907-1992) theorized that eventual declines in fertility would transform developing-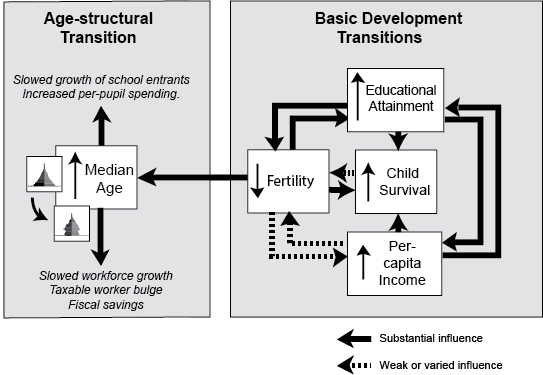 country age structures. Coale and Hoover demonstrated that these newly transformed age structures would exhibit larger shares of citizens in the working ages, and smaller shares of dependent children and seniors. This transition, they argued, would someday help lift countries with youthful populations in Asia, Latin America, and Africa out of the low-income bracket. [read more … ]
To read the essay on New Security Beat, click here. To download the essay, click here.
![]()
 UN figures indicate that Bangladesh, a state once identified with natural catastrophes and rock-concert relief, is on the cusp of its demographic window (reflected in its age structure, shown in Figure 1, below)—a period of favorable age structures that researchers associate with an increased pace of development and a more stable political future. Bangladesh is already a solid member of the World Bank’s lower middle-income class. According to a set of statistical models that we have developed, by 2030 Bangladesh appears to have an even chance of reaching the Bank’s upper middle-income class (roughly US$4,000 to $12,000 per capita annually). For a country that Henry Kissinger famously dubbed “a basket case” at independence in 1971, that prospect is impressive.
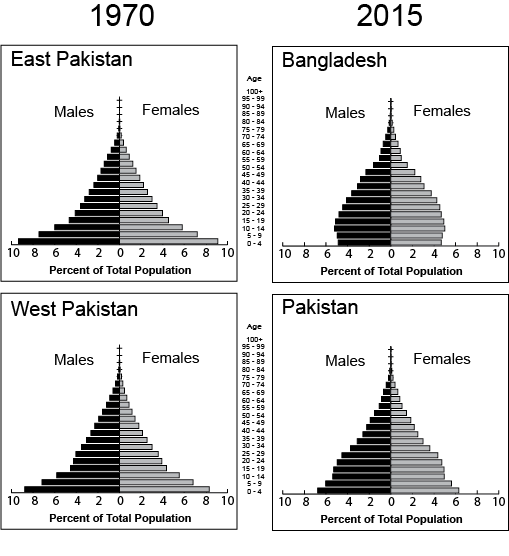
Comparison of age structures, 1970 & 2015, following Bangladesh’s secession in 1971: East Pakistan Provincial Wing becomes Bangladesh; West Pakistan Provincial Wing becomes Pakistan.
This remarkable turnaround is not a big surprise to international health specialists. In 1975, the government in Dhaka began collaborating with the International Centre for Diarrheal Disease Research, Bangladesh (ICDDR/B) to initiate a program of community-based contraceptive distribution in Matlab subdistrict, a long-term health and demographic surveillance site.
Click here to read the rest of … “Bangladesh & Pakistan: Demographic Twins Grow Apart” on the New Security Beat, or download the .pdf here.