The Sample
Data for both independent and outcome variables are drawn from their sources (listed in the following paragraphs) for the years 1972 to 2010, where those data exist. This chronological range of data begins after the independence of the vast majority of colonies that remained in European overseas empires after World War II. Moreover, 1972 is the first year of the Freedom House annual assessment of political rights and civil liberties. Data representing the years 2011 to the present were held in reserve for model testing (discussed later).
The selection of cases is composed of then-extent independent states (following each year’s United Nations independent country list) with a population greater than 500,000, for which there are extant data. The actual annual n depended on the number of cases that met the latter definition of an independent state, and the availability of annual data.
Outcome Variables: Development Transitions
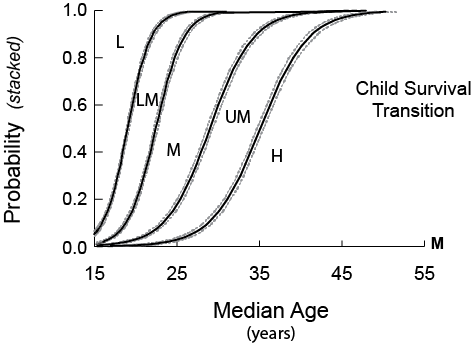 The Child Survival Transition (5 categories, dichotomous). Our analysis of the child survival transition uses data quantifying rates of under-five mortality (U5M) from UNPD estimates (UNPD 2017), covering 5587 country observations over the period from 1972 (n=124) to 2010 (n=164). The categorical breakdown of these data was adapted, in part, from the World Health Organization’s global maps of country U5M levels (WHO 2015). Our five child survival categories, in deaths per 1,000 live births, are: low (≥100.0), lower-middle (50.0 to 99.9), middle (25.0 to 49.9), upper-middle (10.0 to 24.9), and high child survival (<10.0).
 The Education Transition (5 categories, dichotomous). Our analysis of the education transition uses data quantifying the proportion of 20 to 29-year olds, of both sexes, who have attained late-secondary school level or above. These data were drawn from the Wittgenstein Center Data Explorer (WCDGHC 2015). Data are from 4257 country observations from 1972 (n=111) to 2010 (n=161). An annual average of about 10% of cases are unavailable. Our five equally proportioned, late-secondary educational attainment categories, in percent, are: low (<20.0), lower-middle (20.0 to 39.9), middle (40.0 to 59.9), upper-middle (60.0 to 79.9), and high late-secondary school attainment (≥80.0).
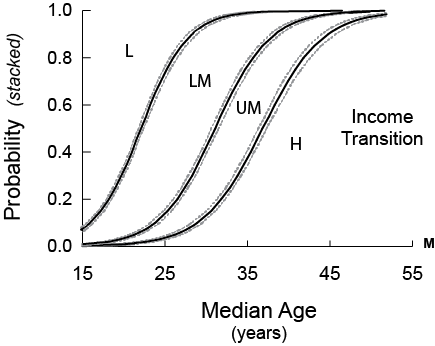 The Income Transition (4 categories, dichotomous). Our analysis of the per-capita income transition draws on the World Bank (2017) World Data Indicators estimate of gross national income (GNI) per capita (Atlas Method) in current $US (2017 data). These data comprise 4803 country observations from 1972 (n=95) to 2010 (n=167). Corrected for inflation, they were disaggregated into the World Bank’s four income classes, according to its 2017 scheme (FY2018 revision): low (<$996), lower-middle ($996-$3895), upper-middle ($3896-$12,055), and high income (>$12,055).
References
[UNPD] UN Dept. of Economic and Social Affairs, Population Division. 2017. “World Population Prospects: The 2017 Revision.” New York: United Nations.
[WCDGHC] Wittgenstein Centre for Demography and Global Human Capital. 2017. “Wittgenstein Centre Data Explorer, Version 1.2.” Laxenburg: Wittgenstein Center for Demography and Global Human Capital.
World Bank. 2017. World Development Indicators. Washington, DC: World Bank.