Statistical Predictions for Individual States
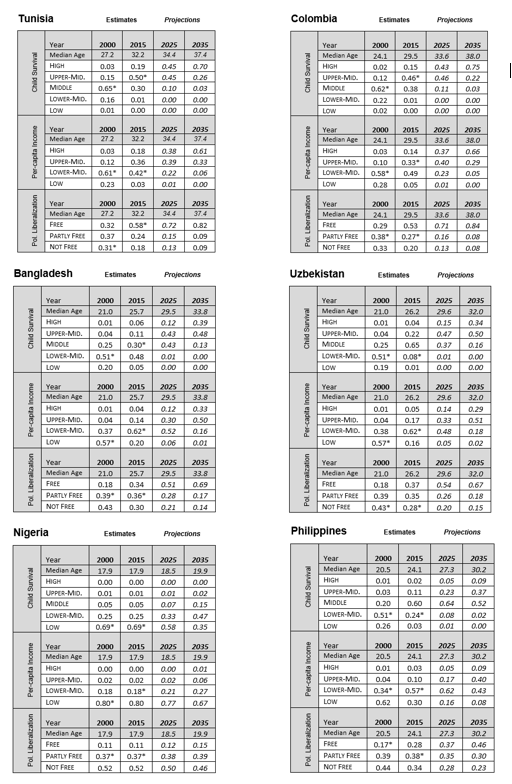
The following review employs the previously described methods to generate statistical predictions for six individual states (Tunisia, Colombia, Bangladesh, Uzbekistan, Nigeria, and the Philippines). Tables of these predictions (Table 1, a-f) provide probabilities for the multiple categories encompassed by each of three transitions: child survival (high, upper-middle, middle, lower-middle, and low), per-capita income (high, upper-middle, lower-middle, and low), and political liberalization (Free, Partly Free, and Not Free). Tables for each country have been generated for four years: two based on past estimates of median age, 2000 and 2015; and two based on projections of median age, 2020 and 2025, using the UN medium fertility variant (UNPD, 2019 Revision).
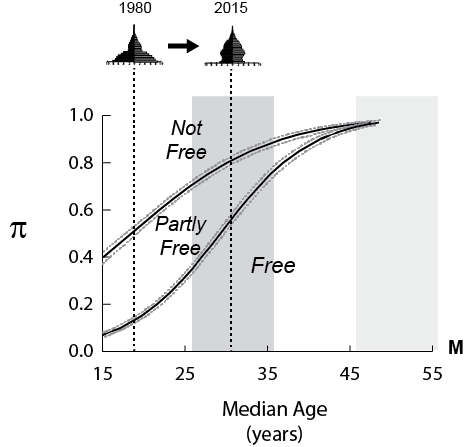
These statistical forecasts are generated by computationally passing a line, perpendicular to the Y-axis at the projected median age, cutting through the set of categorical functions. The probabilities of being in a category correspond to the length of the line segment within each the transition’s categories. These tables of probabilities can yield a reasonable statistical view of the future, particularly when that projection is no more than two decades beyond the present, and when the analyst is cautiously observant of confounding conditions (outlined in the previous sub-section).
Interpreting Individual Statistical Predictions
A few brief observations demonstrate how these individual-state statistical expectations and forecasts can be interpreted. Two questions are pertinent to these predictions (Table 1). First, how well does their actual performance match the age-structural functions’ predictions in 2000 and 2015—the years for which published outcomes are available? Secondly, what should be expected in 2025 and by 2035?
Tunisia. Although Middle East scholars ridiculed age-structural modelling’s predictions, Tunisia’s attainment of liberal democracy (Free) was consistent with its movement through the age-structural domain (Fig. 1). In fact, Tunisia’s social, economic, and political development has been wholly consistent with age-structural modeling’s statistical expectations. While its liberal democracy is threatened by jihadist violence and spillovers from Libya’s ongoing civil war, it’s not outlandish to suggest that Tunisia will continue to meet expectations in 2025 and 2035.
Colombia. Like Tunisia, Colombia’s child survival transition has remained consistent with its age structure. However, while slightly ahead of expectations in terms of per-capita income, Colombia lags in its transition to liberal democracy (Free). Just one-half point from Freedom House’s Free rating (FH, 2019), the age-structural model’s predictions are clearly in favor of Colombia’s attainment of Free by 2025—yet, it’s not guaranteed. Attaining Freedom House’s assessment of Free appears to hinge on the Colombian government’s ability to negotiate an end to the decades-long civil conflict with the remaining active insurgent, El Ejército de Liberación Nacional (ELN).
Bangladesh. While most analysts are surprised by its recent advances in per-capita income and child survival, Bangladesh’s pattern of development is highly consistent with the statistical expectations of its age-structural functions. Despite the intensity of its political and environmental problems, it would not be unreasonable to predict its ascent to liberal democracy by 2035. Given those environmental and political problems, it will be instructive to see if Bangladesh stays on track in child survival and per-capita income.
Uzbekistan. Despite having been politically melded to the more developed republics in the Soviet Union, Uzbekistan has lagged behind expectations in child survival and income. Nonetheless, in the coming decade, its population will shift deeply into the demographic window. Is this a signal of a coming Central Asian Spring? Perhaps—at the very least, foreign policymakers should expect pro-democracy protests, countered by government-induced piecemeal doses of liberalization. However, it is questionable how far liberalization can proceed in Central Asia—a region in which states frequently deter jihadist violence, and one that must deal with the intrusive interests of four of the world’s most militarily powerful autocratic regimes: China, Iran, Turkey, and Russia.
Nigeria. Nigeria’s levels of development have stayed fairly consistent with the expected pattern. Its economic development is somewhat better than expected, but not surprisingly so. There is no reason to expect anything should change. Consistent with Nigeria’s high level of population growth and sustained youthfulness, it would not be unrealistic to expect escalated civil and ethnic conflict. And, given the pattern observed elsewhere it would not be unrealistic to expect Nigeria’s breakup into a northern and southern state by 2035.
Philippines. Typical of countries that attain Free status when youthful (from 1996 to 2004), the Philippines lost this status in 2005 and has yet to regain it. By 2015, its development ratings were more consistent with age-structural modeling’s statistical expectations. Whereas the Philippines has sustained only very slow declines in fertility since TFR dropped below seven children per woman in the early 1960s, recent estimates and projects appear more optimistic. If these new projections hold, there is reason to predict that its political regime could regain Free status before 2035, and likely maintain it for the foreseeable future. However, political stability may rest on resolving the ongoing conflict in Mindanao.
Regional and Sub-regional Forecasts
The ultimate accuracy of forecasts of individual countries (like those explored, above) or even of forecasts that focus sub-regional sets of three to five states is limited by the small number problem: the smaller the number of cases (countries), the less likely that at least one of those cases will behave in the manner that is most statistically expected (i.e., the highest probability behavior). In other words, in forecasts that employ age-structural theories of state behavior, an analyst has the best chance to correctly anticipate a categorical shift if the forecast is spread over a large-as-possible group of countries that are currently in the same age-structural phase, that are projected to be age-structurally similar in the future (i.e., they have hardly advanced, or they have advanced into another phase, or near an attractor). Two practical multi-country alternatives are available: (a.) age-structural phase mapping, and (b.) regional summary tables.
Phase mapping requires that the world’s countries be color-coded by their present age-structural phase, according to current UNPD estimates. A second map, using the UNPD medium fertility variant, should be color-coded to represent a future target date—such as 15 to 20 years into the future. Analysts have used these maps (see NIC, 2017) to visually identify groups of states that, , in the next two decades, will experience similar risks of experiencing revolutionary conflict (e.g., those in the Sahel and equatorial Africa), to pick out countries that have an elevated chance of gaining stable liberal democracy (e.g., states in the Maghreb, and in South America), and to identify states that will experience fiscal pressures from population aging (e.g., those in eastern, central, southern Europe, and East Asia).
Regional summary tables are lists in which around 20 to 25 states from a single region or sub-region have been ordered by their median age (highest median age at the top, successively younger states below, most youthful states at the bottom). These regional tables provide an alternative means for analysts to visualize, compare, and monitor the relative progress of neighboring states through the age-structural transition. Analysts have used these lists to make forecasts based upon the current and future positions of states in age-structural time (Cincotta 2017).