(the 7 regional tables appear below this text, and can be downloaded in an Excel workbook form: Regional Table Workbook)
The principal goal of numerical political demography has been to give analysts a testable theory that could be put to work to help them do a better job at anticipating political change and stasis. A discussion of political demography’s forecasts have become a fixture in the National Intelligence Council’s Global Trends publications (see the NIC’s latest addition to the GT series, “Paradox of Progress”, pages 161-167). Still, we seem far from the day when young analysts in the US intelligence community routinely consider political demography’s “basic rules” as essential analytical tools.
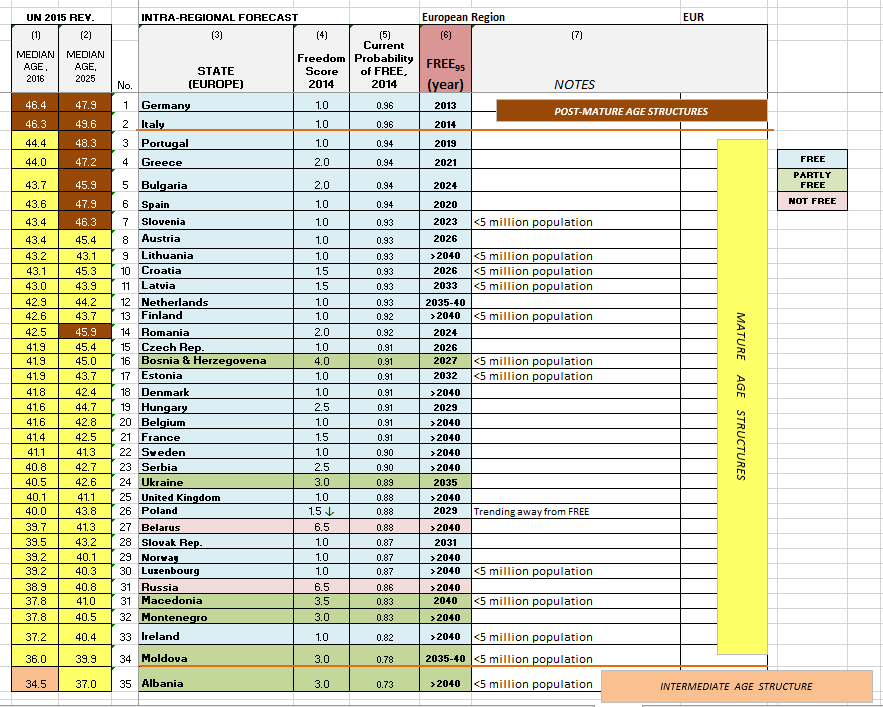
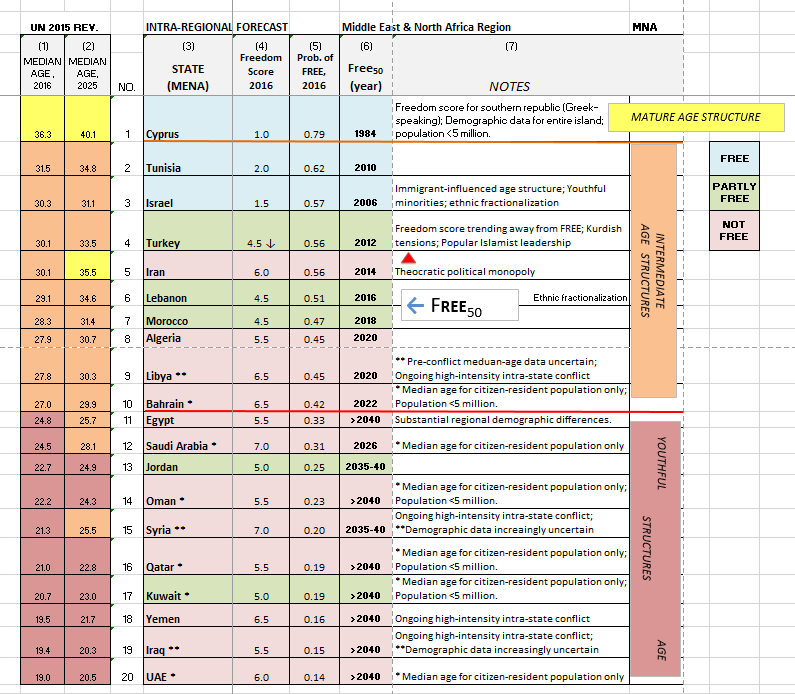
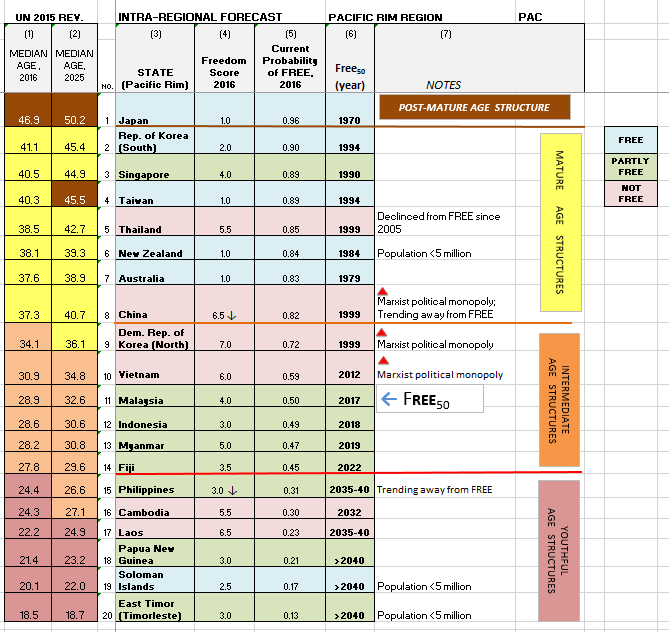
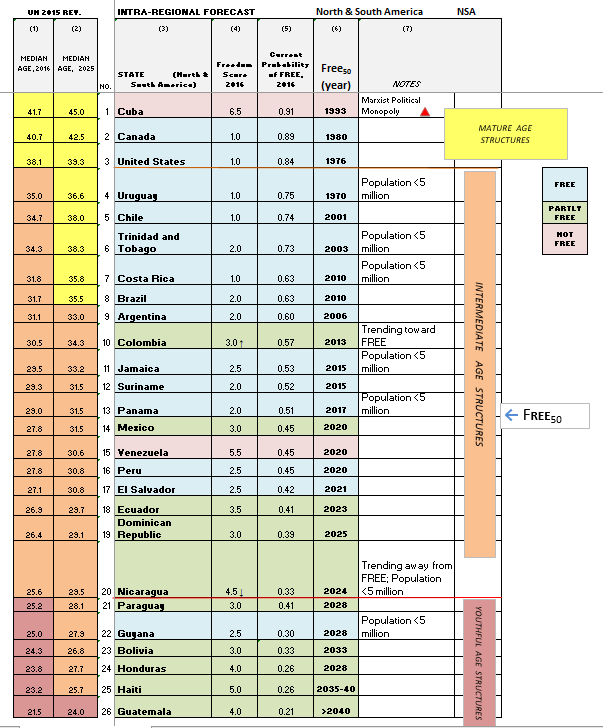
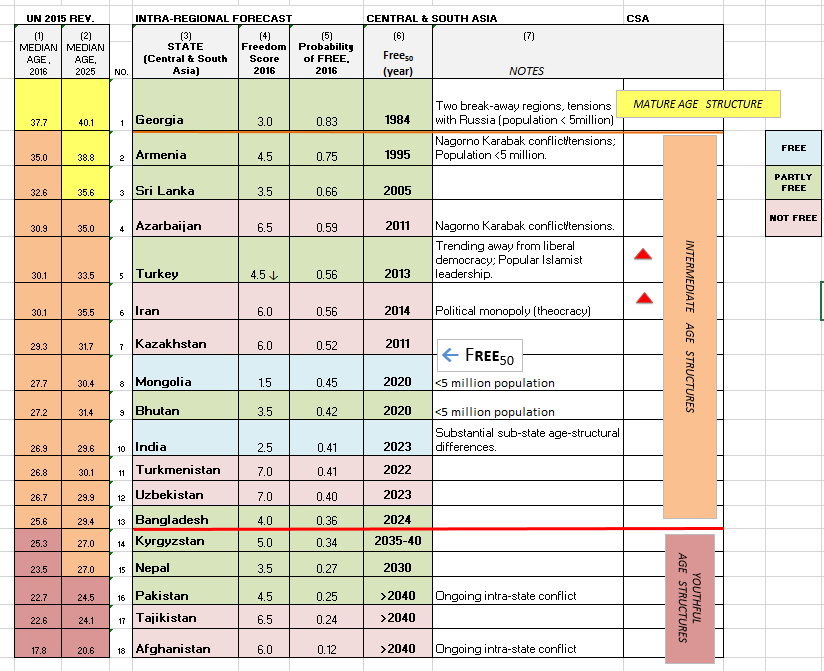
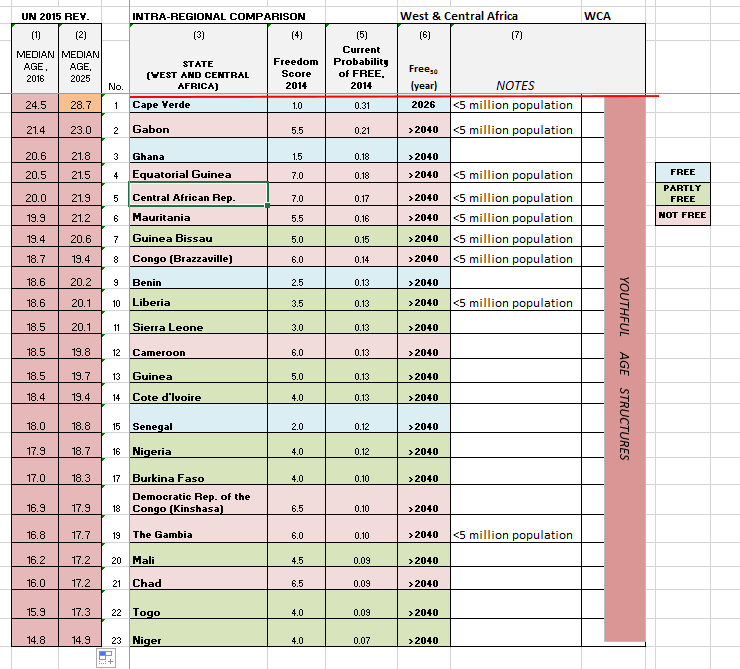
In this short essay, I present the world in 7 Regional Forecasting Tables. These feature a regional collection of countries, all with populations over 500,000. The countries are arranged by median age: highest median age (most mature age structure) at the top; lowest median age (least mature age structure) at the bottom. With these tables, and with some practice, analysts should be able to acquire insights into their near and medium-term future.
First, a set of eight “rules” (theoretical expectations) for working with these tables:
-
- Expect states at the top of the list, the most age-structurally mature, to experience the best chance of being a liberal democracy – that is, to be assessed as Free in Freedom House’s annual Freedom in the World global survey (most analysts consider Free status to be synonymous with liberal democracy).
- Expect states that have a youthful age structure (below a median age of 25.5 years) to be the least likely to be assessed as Free, and the most likely to be engaged in intra-state conflict of either low or high intensity, as measured by the .
- Where revolutions occur in a state with a youthful population, expect either the authoritarian regime to remain in power, or to be replaced by another authoritarian regime (typically Not Free or low-level Partly Free, as measured by Freedom House).
- Expect states that achieve Free while youthful to lose this rating within a decade. There is a long history of this effect (look to Mali for a recent example).
- Expect states with a population of less than 5 million to be the most likely to break rules 1, 2, 3 and 4 (and see the UN Population Division for reliable population data).
- Expect states that are ruled by an ideological single-party regime or another type of ideological political monopoly – for example, Iran’s theocracy – to mature without liberalization. China and North Korea are other prominent examples.
- Expect states led by a revolutionary (Cuba under Castro, Venezuela under Chavez) or a charismatic reformer (Russia under Putin, Turkey under Erdogan, Singapore under Lee Kwan Yu) to resist attaining Free.
- Expect a state ruled by a military autocrat, or junta, or an absolute monarch to yield to a more liberal regime before the population attains a mature age-structure (before a median age of 35.5 years).
The Seven Regional Forecasting Tables (showing states with populations over 500,000)
MIDDLE EAST & NORTH AFRICA REGION
THE PACIFIC RIM REGION
NORTH & SOUTH AMERICA
EAST & SOUTHERN AFRICA

CENTRAL & SOUTH ASIA
WEST AND CENTRAL AFRICA
EUROPE