July 17, 2023 Richard Cincotta
Over the past several months, members of the foreign affairs and development communities have heaped a great deal of attention—and interpretation—on the pace of demographic change in Nigeria.
This groundswell began in March of this year, when an article in the Economist argued that, due to evidence of a dramatic decline in the lifetime rate of childbearing (the total fertility rate, or TFR), Nigeria should be added to sub-Saharan Africa’s list of promising demographic transitions. Then, the author of a June article in Foreign Policy likened Nigeria’s current demographic conditions to the development-favorable age distributions that began to emerge in China’s population during the 1980s, asserting that Nigeria “has been in the throes of one of the most remarkable demographic transitions the world has seen in the last century.”
If this stunning claim is accurate, it’s very good news. With a much-improved age structure due to emerge in the near future, Bola Tinubu, Nigeria’s newly elected president and the former governor of Lagos state, would be stepping into office at an opportune time to attract investors and refashion the country’s oil-dependent economy.
But are these descriptions really accurate? Or are they just wishful thinking? Frankly, at this point, it’s hard to be absolutely certain—and very easy to be skeptical. Perhaps a closer examination of some of the details of the ongoing controversy over Nigeria’s demographic transition will offer clearer answers.
Disparate Surveys
Enthusiasm over Nigeria’s demographic prospects is owed to two recent countrywide surveys. The first is Nigeria’s 2021 Multiple Indicator Cluster Survey (NMICS-2021), a UNICEF survey designed to estimate a wide range of health indicators among women and children. The second is its 2021 Nigeria Malaria Indicator Survey (NMIS-2021), a USAID-sponsored assessment of Nigeria’s progress toward eradicating malaria.
Each of these surveys has its own focus. For the malaria assessment, childbearing is strictly a secondary calculation. For the Multiple Indicator Cluster Surveys (MICS), maternal and child health are most important. The controversy stems from the fact that abrupt changes in fertility detected in NMICS-2021 and NMIS-2021 follow only three years on the heels of Nigeria’s 2018 Demographic and Health Survey (NDHS-2018), a more intensely sampled, broader USAID-designed survey that most demographers see as the standard for estimating fertility and its contributing factors.
Notably, demographers caution against integrating Demographic Health Surveys (DHS) and MICS results, or even using one set of results to validate the other. (Admittedly, this is something I am doing here). In fact, Nigeria’s implementing agencies routinely expect to encounter variation in their published estimates owing to the year of the survey (the DHS and MICS are purposely staggered) and to differences in samples, field methods, statistical techniques, and logistics.

Despite these caveats, most measures related to childbearing that have been estimated by Nigeria’s MICS over the past two decades seem roughly consistent with DHS. Until recently, that is (Fig. 1a & b).
Figure 1: Total fertility rate: Nigeria’s North and South DHS and MICS.
While demographers have grown accustomed to seeing greater changes across Nigeria’s more densely populated coastal south than in the far north, NMICS-2021 reports that total fertility rates have dropped steeply, and nearly uniformly, across all of the country’s six regions. It is a trend that West African demographers have dearly hoped for but now eye a bit suspiciously.
Demographic Skepticism
Demographers can, indeed, be overly skeptical when faced with unexpected evidence of demographic change. For example, UN demographers repeatedly dismissed early surveys showing the first signs of Iran’s record-breaking decline from more than six children per woman in the mid-1980s to around two children per woman by 2000. During the following decade, a few demographers suspected that much of Bangladesh’s reported shift to the two-child level might be due to sampling error. It wasn’t.
Yet, it pays to be cautious. Populous countries containing several proportionally large ethnic populations, each inhabiting a distinct eco-climatic or cultural zone—like Nigeria, Ethiopia, Egypt, or Pakistan—tend to stall outright, or enter their fertility transition piecemeal. In the latter case, fertility typically declines first in the large cities, after which this effect spreads slowly, region by region, as fertility’s contributing factors—including girls’ educational attainment, delayed marriage, child spacing, and knowledge and availability of contraception—make gains locally.
Like China?
Whether Nigeria’s current total fertility rate is nearer to 5.3 (NDHS-2018), 4.6 (NMICS-2021), or somewhere in between (like NMIS-2021’s estimate of 4.8), the future trajectory of the country’s ethnically heterogeneous population is unlikely to parallel China’s or any of the nearby East Asian tigers’ (Japan, South Korea, Taiwan, or Thailand) more homogeneous populations.

As the June Foreign Policy article points out, China was, itself, in the throes of experiencing a set of age distributions forty years ago that advantageously bulged among working-age adults while featuring relatively small proportions of dependent children and retirees (Fig. 2a, which is narrow at both the bottom and top). Even before Beijing officially set in motion its notoriously coercive One-Child Policy in 1980, China had (according to UN estimates) already dropped to about 2.7 children per woman. If the MICS-2021 estimate of 4.6 children per woman is accurate, Nigeria’s total fertility rate would still be nearly two-children per woman higher than China’s countrywide level at that time.
Figure 2: Age Structures for China, 1985 and Nigeria, 2020.

In contrast to China’s population in the 1980s, Nigeria currently retains much of the youthful age structure (Fig. 2b, a broadly pyramidal profile), rapid growth, and chronic stress on its health and educational services that have constrained its development over the past 60 years.
Figure 3: Three Very Different Transitions: 1980, 2000, 2020, for China, Nigeria, and India.
Rather than focus on China’s rapid fertility transition and the restrictive reproductive policies that took that country to very low levels of fertility (well below 1.5 children per woman), the slower, region-by-region transformations of more ethnically and culturally diverse populations—such as India, South Africa, and Indonesia—offer model trajectories that may be more appropriate for Nigeria and its coastal West African neighbors (Fig. 3).
Nigeria’s North-South Divide
Of all the trends reported by NMICS-2021, the sudden drops in fertility in Nigeria’s two most northerly, culturally Sahelian, and predominantly Muslim regions were the least expected. If confirmed by the next DHS (NDHS-2023, which is already in the field), these declines could represent a narrowing of the fertility gap between north and south. It is a gap that Marcin Stonawski of the International Institute of Applied Systems Analysis and his colleagues suggest coincides with the imposition of Sharia law (beginning in 1999) at the state level in 12 of the country’s most northerly states.
Instead, if the two regions were to continue to diverge, Nigeria’s long-term prospects as a politically unified state would likely dim. Should the country’s future demographic dividends (measurable gains in health status, educational attainment, and income) concentrate narrowly among Nigeria’s densely populated southern coastal states, while political power slowly shifts northward as the nation’s Hausa and Kanuri-speaking populations grow, it would not be unreasonable to expect more visible activism among ethno-political movements in the south—particularly Yoruba nationalism in the southwest, and rekindled Igbo separatism in the southeast.
Getting to the Demographic Window
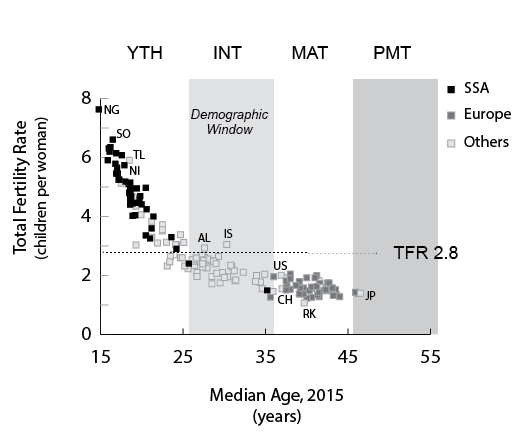
If the multiethnic, multireligious, multitudes of India can make their way through the transition to two- and three-child families and ultimately advance into the demographic window—beginning at a median age of around 26 years and fading near 40 years (Fig. 4)—why not Nigeria? It wasn’t easy for India’s state programs, nor would it be any easier for President Tinubu’s government, particularly in Nigeria’s north, where the state has made only modest progress on keeping girls in school, eliminating underage marriage, and reducing teen childbearing. But it’s possible. And, if NMICS-2021 is reasonably accurate, the process may already be well underway countrywide.

Figure 4: Getting to the Demographic Window in Nigeria, India, China, 1980-2020.
Whatever the case, Nigeria could do better. Using its oil wealth, the country has generated a large cadre of health professionals with the training to expand and increase the effectiveness of their family planning program while avoiding mismanagement and quality issues. Unfortunately, Nigeria has a poor record of health financing in general, and it has yet to adequately fund its family planning and reproductive health efforts.
Statistical skepticism aside, demographers are hopeful that Nigerian survey teams, now preparing to take NDHS-2023 questionnaires to the field, will find Nigeria’s major demographic indicators to be consistent with estimates obtained from NMICS-2021. Declines in fertility of this magnitude and geographic coverage, while steeper than prior surveys, are not only possible, they’re overdue.
Richard Cincotta is a Global Fellow with the Wilson Center’s Environmental Change and Security Project.
Sources: The Economist; Foreign Policy; Journal of Modern African Studies; The Lancet; UNICEF; USAID

 Over the past 25 years, economic and political demographers have focused on documenting the improvements in state capacity and political stability that have been realized in the wake of fertility declines in much of East Asia, Latin America, and most recently in the Maghreb of North Africa (Tunisia, Morocco, Algeria). Nonetheless, foreign affairs, defense and intelligence analysts still seem confused over when and where this demographic dividend should occur—and whether the youthful, low-income states of Sub-Saharan Africa are due to experience the dividend’s economically favorable age structures anytime soon. Because two very different development narratives vie for these analysts’ attention, their confusion is not that surprising.