Predicting the Rise and Demise of Liberal Democracy: How well did we do?

by Richard Cincotta

In 2007, at the (U.S.) National Intelligence Council, a colleague and I set out to determine if we could forecast two distinct political phenomena, the rise and the demise of high levels of democracy. To guide our decade-long forecasts, we relied on a simple statistical model and a spreadsheet of demographic projections from the UN’s 2006 World Population Prospects data set. Now that the experimental period (from 2010 to 2020) has ended, we can look back and ask: How well did these forecasts perform? 

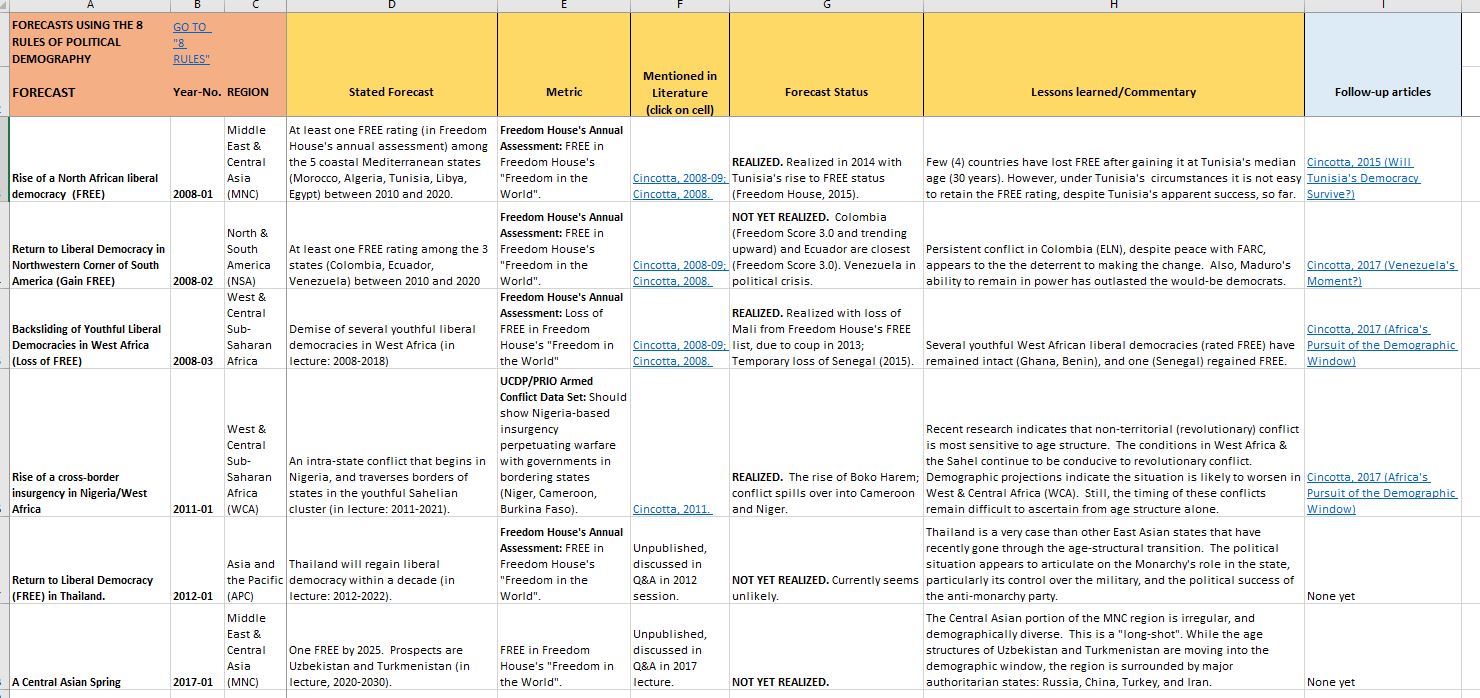
Overall, surprisingly well; but by no means, flawlessly. In fact, we expected too much political liberalization during a decade when democracy was largely in retreat. Yet, had our age-structural forecasts been taken more seriously when first presented and published (see “Half a Chance”, published by the Wilson Center’s Environmental Change and Security Program), foreign affairs analysts might have been amply forewarned of two of the decade’s most unanticipated political events: Tunisia’s rise to liberal democracy (Free in Freedom House’s annual assessments); and the demise of four of West Africa’s liberal democracies (decline from Free to Partly Free or Not Free).

To continue reading, go to: New Security Beat, Predicting the Rise and Demise of Liberal Democracy: How well did we do?

The age-structural model of liberal democracy, based on Freedom House’s (FH) annual assessments (Free, Partly Free, Not Free). Data: FH, 1972 to 2010.

Attachments

Statistical Forecasting Using Median Age

Statistical predictions can be made from can be made from simple curves (see Figure below for Tunisia). This brief essay shows how drawing a line through a set of age structural functions (functions that describe the shift in a categorical probabilities over the age-structural transition) yields a set of probabilities for each category. To see how it’s done for child survival, per-capita income, and liberal democracy, and to see the predicted outcomes for Tunisia, Colombia, Bangladesh (this one is surprising!), Uzbekistan, Philippines, and Nigeria, click here or go to the “Individual State Forecasts” page in the Forecasts menu.


Fig. 1. Tunisia’s path, from 1980 to 2015, to a higher probability of being assessed as Free in Freedom House’s annual survey of political rights and civil liberties. Once in the demographic window (the intermediate phase, shaded in dark grey), the chances of retaining Free are much higher than in the preceding youthful phase.

Youthful Clusters of States: The Future of Revolutionary Conflict

Youthful Clusters

Have you ever noticed that shifts in the world political order are clustered in time and geographical location? For example, the late-1980s and 1990s, economists and political scientists were caught off guard by the economic rise and a series of political reforms among the East Asian Tigers (South Korea, Taiwan, Thailand, Singapore, and Indonesia), quickly setting them apart from the rest of the developing world. The Tigers’ successes were followed in the early 2000s by an unheralded burst of liberal democracy among Caribbean and Latin American states (including Brazil, Chile, Argentina, Guyana, Trinidad & Tobago).  Then, beginning in 2010, came the Arab Spring, during which Tunisia’s attainment of liberal democracy caught regional political experts completely off guard.

However,  demographers were less surprised (see 2008/09 article predicting the rise of a democracy in North Africa). The states of these regions were entering the demographic window–a period during the age-structural transition when states typically progress economically and often undergo political changes.

Similar temporal and geographical clustering arises where progress in the age-structural transition has not occurred; i.e., among youthful clusters of states that are “stuck in age-structural time.” Today, the vast majority of revolutionary conflicts (insurgencies that are focused on overthrowing the political system or altering the central government, as indicated in the latest (2017) version of the UCDP/PRIO Armed Conflict Data Set) occur in youthful states—those with a median age at or below 25.5 years.  Youthful states typically appear in clusters, and these conflicts tend to spread across their borders, typically stopping at the borders of non-youthful states.

In the following 6 regional tables (South Asia & the Pacific Rim; West & Central Africa; East & Southern Africa; the Middle East, North Africa & Central Asia; the Americas; and Europe), I’ve divided the world into 21 clusters of states. In 1975, 18 of those clusters were dominated by youthful states–countries with a median age of 25.5 years or less.

A lot has transpired since then. I track the cluster to 1990, and 2020 (a very short-term projection), and finally a projection to 2035 (using the UN Population Division’s medium fertility variant). As the years progress, states experiencing fertility decline advance to the next phase of the age-structural transition (the intermediate phase, between a median age of 25.6 and 35.5 years). These drop out of the cluster until, as in 3 cases, the youthful cluster disappears (see Table 1, below).

Table 1

However, 16 clusters still remain.  Four situated along the midriff of Africa (West Africa Coastal Cluster, the Sahelian Cluster, Central African Cluster, and South Central African Cluster), within the tropics, persist just as they did over 40 years ago. These are Western and Central African clusters likely to be significant sources of revolutionary conflict and other forms of political instability throughout the rest of the century.  Another 7 clusters (in the Middle East, other parts of Asia, and Africa) have gone through minor and major changes also generate ongoing as well as future risks. However, according to the UN Population Division’s demographic projections, these may gradually fade over the coming three decades.

The final 5 clusters of states are “in transition.” The states in these groups are experiencing fertility decline and shifting to the intermediate phase of that age-structural transition. These youthful clusters may disappear over the coming two decades.

Separatist Conflicts Persist, While Revolutions Just “Age Away”

Since the seminal research of Herbert Möller in the late 1960s and Jack Goldstone in the early 1990s, numerous political researchers have called attention to the tendency of countries with youthful populations—often called a “youth bulge”—to be more vulnerable to civil conflict than nearby states with a more mature population. Then a 2016 article upset political demography’s apple cart. When investigating countries with at least three consecutive years without an intra-state conflict, Omar Yair and Dan Miodownik found a fundamental difference between ethnic and non-ethnic warfare. The risk of a non-ethnic conflict was, indeed, higher under youth-bulge conditions. However, they found that youth bulges (measured at the country level, rather than at the ethnic level) were unrelated to the risk of an onset of an ethnic conflict.

La Différence Vit?

In research for a soon-to-be-published article, I set out to investigate a bit beyond Yair and Miodownik’s conclusions, asking two new questions:

  • Do the differences that Yair and Miodownik observed extend to countries with a history of recent of conflict?
  • How do these effects play out over the course of the age-structural transition—as populations age, shifting from a youthful population with a low median age, to a more mature population with a high median age?

For the rest of the article on New Security Beat … CLICK HERE.     Or download briefing: “Revolutions Just Age Away” in .pdf.


Fig. 1.  The patterns of 5-year risk of (a.) revolutionary conflict and (b.) separatist conflict  over the length of the age-structural transition. While the three types of conflict-history cases of revolutionary conflict (absent, intermittent, persistent) all respond to aging, the same classes of separatist conflict appear much less responsive.

Conflict history classes: Absent: without conflict during the prior four years; Intermittent: 1 or 2 years of conflict during the prior 4 years; Persistent: 3 or 4 conflict years during the prior 4 years.


Attachments

Age-structural Forecasts (from the 8 Rules)

Political DemographyTracking Forecasts and Their Outcomes.  It’s one thing to make timed forecasts (difficult), it’s another to track them (boring), note the successes and failures (a bit more interesting), and modify the theory to learn from the outcomes (painful). The theory behind these forecasts are summed up in the New Security Beat essay, “The 8 Rules of Political Demography“.  Age-structural theory is covered in a longer article in the Oxford Research Encyclopedia of Politics.

The following spreadsheet (image posted below, downloadable here as an Excel Spreadsheet) is an effort to account for both the successes and failures of age-structural forecasts.  Several forecasts have been discussed in lectures, but have not yet been published in either journals or in web essays.  The next web essays will put these in print.


Attachments