8 Rules of Age-structural Political Demography

In a world rapidly churning out unpredictable political shocks, intelligence analysts occasionally need to clear their heads of the daily barrage of newsworthy events and instead work with simple theories that discern the direction and speed of trends and help predict their outcomes. Political demography, the study of population age structures and their relationships to political trends and events, has helped some analysts predict geopolitical changes in a world that, from time to time, appears utterly chaotic.

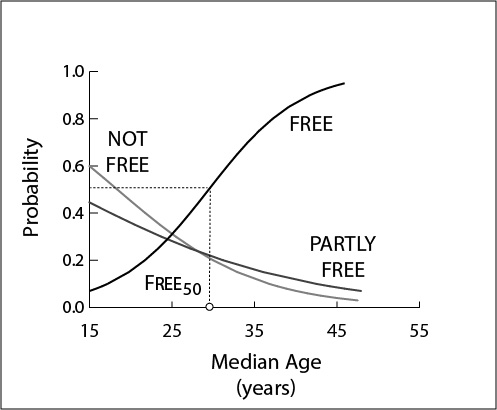
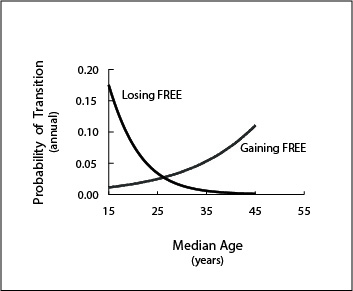
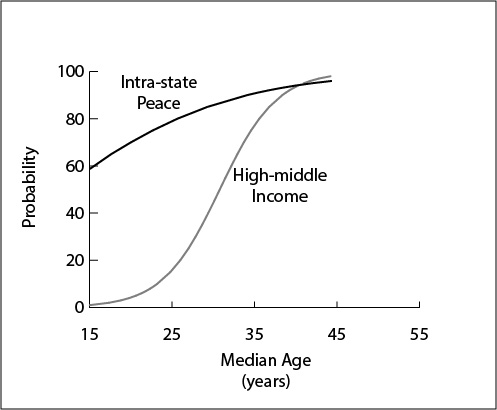
Much of my recent work has focused on democratic transitions and age structure – that is, what the median age of a country can tell us about its propensity to become a “liberal democracy” or remain either undemocratic (without free, fair, and politically meaningful elections) or illiberal (short on civil liberties and rule of law). There is, in fact, a strong correlation in recent history between increasing median age and increasing liberal democracy, and vice versa (the younger a population is, the less likely it is to be a liberal democracy). These and other age-structural relationships have become so evident over the past three decades of research, that political demographers can now identify “rules” that link demographic characteristics to expected political outcomes.

For the rest of this essay, go to The 8 Rules (also posted on the New Security Beat) … and see the 7 regional tables at this site. Download an Excel Workbook of tables here.

Attachments

Creating Regional Forecasting Tables

Regional Forecasting Tables (RFTs)

RFTs provide analysts with a regional statistical summary at a glance–a graphic way to show how the states of a geographic region stack up against each other, both in terms of their statistical possibilities and statistical vulnerabilities.

To create an RFT, one needs a group of states that are sufficiently large (at least near 20 states, each with a population greater than 500,000) and sufficiently diverse (at least 15 years of median age between youngest and mature population).

The following RFTs are available on this website: Middle East-North Africa (MENA); North and South America (NSA); The Pacific Rim (PAC); East and Southern Africa (ESA); Central and South Asia (CSA); West and Central Africa and the Sahel (WCA); Europe (EUR). (for all 7 tables, see ALL).

Figure 1. The functional form of the Age-structural Model of Liberal Democracy, showing Free50 positioned at the median age of 29 years.

The first step in creating an RFT is to order its countries (see Table 1, for the Middle East and North Africa). Using the UN Population Division’s most recent estimates and medium projections, RFTs are ordered (low to high) by their median age.  They also list (in col. 6) the year that each country is estimated or projected to pass the median age of 29 years—a point identified as Free50.  At Free50, 50.0 percent of countries have been assessed as FREE (generally used as an indicator of liberal democracy) in Freedom House’s annual assessment of civil liberties and political rights (see Fig. 1).

In the European Region’s table (EUR), all states have passed Free50. In this table, column 6 lists the year that each state will pass Free95–a median age of 45.5 (the beginning of the age-structural transition’s post-mature phase). At this point, the age-structural model gives states a 0.95 percent chance of being assessed as FREE.

How does one read an RFT? Using the following eight rules.

Analysts should expect :

  1. Expect states at the top of the list to experience the best chances of being assessed as Free in Freedom House’s annual survey (most analysts consider Free status to be synonymous with liberal democracy) (see Freedom House, Freedom in the World data);
  2. Expect states that have a youthful age structure (below a median age of 25.5 years) to be least likely to be assessed as Free, and most likely to be engaged in an intra-state conflict (of either low or high intensity, using UCDP/PRIO data base).
  3. Where revolutions occur in a state with a youthful population, expect either the authoritarian regime to remain in power, or to be replaced by another authoritarian regime (typically Not Free, or low-level Partly Free);
  4. Expect states that achieve Free while youthful to lose this rating within the next decade;
  5. Expect states with a population of less than 5.0 million to be the most likely to break rules 1, 2, 3, and 4 (see UN Population Division for annual population);
  6. Expect states that are ruled by an ideological single-party regime or another type of ideological political monopoly (for example, Iran’s theocracy), and thus to mature without liberalization (China, North Korea, Iran) (see Authoritarian Regimes Data Set for single-party and theocratic regime status);
  7. Expect states led by a revolutionary (Cuba under Castro, Venezuela under Chavez); or a charismatic reformer (Russia under Putin, Turkey under Erdogan, Singapore under Lee Kwan Yu) to resist attaining Free until that popular individual exits the political system.
  8. Expect states ruled by military juntas and absolute monarchs to yield to more liberal regimes before it attains a mature age-structure (before a median age of 35.5 years).

Below is a sample table, summarizing the Middle East-North Africa Region (MENA) in 2016 (20 states with populations over 500,000).  Note that column 1, the current median age, orders the table from top (most mature age structure) to bottom (least mature). Columns 2 provides the UN Population Division’s medium fertility variant projection of the median age in 2025. Column 3 provides the name of the state. Column 4 provides the most recent end-of-year Freedom House score. Column 5 provides the current probability of being assessed FREE (according to the Age-structural Model of Liberal Democracy) by Freedom House. Column 6 provides the year at which the state’s population will pass the 50.0% probability of being assessed as FREE. Column 7 lists pertinent notes, including impediments to achieving FREE, and irregularities in the data or measures.


Attachments

Regional Forecasting Tables: The Rules of the Game

The Rules of the Game

Three types of rules help analysts interpret an Regional Forecasting Table (RFTs).

  • Trends. Age-structural trends are models that describe the chances of a state exhibiting a particular behavior (such as a regime type, engagement in an intra-state conflict, or attainment of a level of development) probability of a behavior continuously over the range of median ages (15 to 47 years). Trends describe the along the range of country-level median ages (15 to 47 years).
  • Conditions. These exceptional conditions allow states to defy the latter set of trends. In other words, they identify types of “rule breakers”.
  • Conjectures. Conjectures are preliminary hypotheses. Each is a candidate for ultimately becoming either an age-structural trend or an exceptional condition. However, each requires some degree of additional clarification and testing.

From a scientific perspective, all of political demography’s rules and conditions are hypotheses. Each could fail, be modified, rejected, or displaced by a better performer after a rigorous test or fundamental change in the relationships it describes.

Trends

Figure 1. The functional form of the Age-structural Model of Liberal Democracy, showing Free50 positioned at the median age of 29. [Trend 1]

Trend 1 [. States at the top of the table (higher median ages) should have a better chance of being a liberal democracy (assessed as FREE). Countries at the bottom of the list (lower median ages) are more likely to be assessed as NOT FREE or PARTLY FREE (see Fig. 1);

Trend 2. FREE states below a median age of 26 years to be prone to losing FREE (descending to assessments of PARTLY FREE or NOT FREE) within the following 10 years (Fig. 2).

Trend 3. states within the youthful portion of the list (below median age of 25.5 years), or near its edge, to the most vulnerable to the outbreak of intra-state conflict. As their population nears a median age of 30 years, they should also be expected to achieve the World Bank’s upper-middle income category (see Fig. 3) and settle civil conflicts, although ethnic conflicts with youthful minorities are likely to persist or intermittently recur.

Figure 2. The age-structural probabilities of gaining FREE and losing FREE, once assessed with FREE status. [Trend 2] 

Conditions.  Of course, there are exceptional conditions for which to watch out.

Condition 1 [Political Monopolies].  States under the control of political monopolistic regimes–single party states, like the remaining Marxist autocracies (e.g., China, North Korea, Vietnam, Cuba) or monolithic non-party states, like Iran’s theocracy, do not appear to “obey the rules.” Monopolistic regimes, particularly the most ideological of them, are difficult to dislodge. As their age structure matures, pressures to liberalize are repelled by ideologically justified suppression of dissent and intimidation. As the age structure matures, the chance for popular revolution typically declines, narrowing the possibility for reform to the emergence of a reformer within the ranks (a Gorbachev), or to external actors.

Condition 2 [Revolutionaries].  Revolutionaries and other charismatic reformers (Russia’s Vladimir Putin, Venezuela’s late-president, Hugo Chavez; Singapore’s late-president, Lee Kwan Yu) who tolerate an opposition, but have a large popular following, are also difficult to dislodge. Their regimes persist as long as they remain alive, and as long as they are able to designate an equally charismatic reformer–which rarely happens. While they may tolerate a weak opposition, they rarely allow a charismatic underling to rise within their own political organization (perhaps with the exception of one of their offspring). Thus, in the long run, their regimes are ultimately prone to change as their age structure matures.

Condition 3 [Small Populations].  States with relatively small populations (I use populations under 5.0 million) often over-perform. They are often “precociously” assessed as FREE, avoid intra-state conflict even as youthful populations, and often achieve the World Bank’s high-middle income category at younger median ages than more populace states (examples are: Costa Rica, Jamaica, Belize, Botswana, Guyana and the Solomon Islands).

Figure 3. The age-structural probabilities of NOT being in a intra-state conflict, and of being in the World Bank’s high-middle income category. [Trend 3] 

Condition 4 [Ongoing Ethnic Conflicts].  States that are involved in significant armed conflicts with ongoing ethnic conflicts or dysfunctional inter-ethnic politics often delay democratization (e.g., Colombia, Sri Lanka, Myanmar, Lebanon). Here, I control for states that have greater than 1,000 battle-related deaths per year, but it may be the case that states are sensitive to smaller conflicts.

Condition 5 [Resource Rentiers].  States that rely on oil or mineral wealth may have the wealth to control dissent and placate discontent, delaying democratization (Russia, the GCC states). I control for states where oil and mineral revenues amount to more than 15 percent of GDP.

Condition 6 [Military Regimes & Absolute Monarchies].  Expect states led by military authoritarians to cede rule to pro-democracy movements before the population age structure reaches the end of the intermediate phase (a median age less than 35.5 years). This constraint also appears to be true for absolute monarchies, perhaps with less certainty.

The following Regional Forecasting Tables are available on this website: Middle East-North Africa (MENA); Latin America and the Caribbean (LAC); The Pacific Rim (PAC); East and Southern Africa (ESA); Central and South Asia (CSA); West and Central Africa and the Sahel (WCA); Europe (EUR).


Conjectures

Conjectures are promising hypotheses, but need considerably more research.

Conjecture 1 [Spillover Hypothesis].  Contiguous pairs and clusters of states with youthful populations risk “spillovers”–conditions under which the insurgency involved in intra-state conflicts crosses borders, affecting adjacent states and relations between states (examples: Taliban in Pakistan and Afghanistan; ISIS in Iraq and Syria; Al Qaida, ISIS, Boko Haram in the Sahel).

Conjecture 2 [Populism Hypothesis]. The coupling of age-structural maturity and immigration appears to be associated with the rise of populist political contenders and receding Freedom scores. If this hypothesis is viable, then analysts may see receding levels of Freedom Scores among post-mature states, and perhaps fewer numbers of FREE among them in the future.

Attachments

East & Southern Africa Regional Forecast

Regional Forecasting Table, 2016: Eastern and Southern Africa

  • 23 states, populations over 500,000
  • Freedom Score & Freedom Status: Freedom House, Freedom in the World, 2017. (New York, FH).
  • Median age: UN Population Division, World Population Prospects, the 2015 Revision. (New York, UN).
  • Probability of FREE (model): Cincotta, R. “Demography and Early Warning: Gauging Future Political Transitions in the Age-structural Time Domain,” J. Intelligence Analysis, 22(2): 129-148.


Pacific Rim Regional Forecast

Regional Forecasting Table, 2016: Pacific Rim Region 

  • 20 states, populations over 500,000
  • Freedom Score & Freedom Status: Freedom House, Freedom in the World, 2017. (New York, FH)
  • Median age: UN Population Division, World Population Prospects, the 2015 Revision. (New York, UN).
  • Probability of FREE (model): Cincotta, R. “Demography and Early Warning: Gauging Future Political Transitions in the Age-structural Time Domain,” J. Intelligence Analysis, 22(2): 129-148.