The Course of the Age-structural Transition

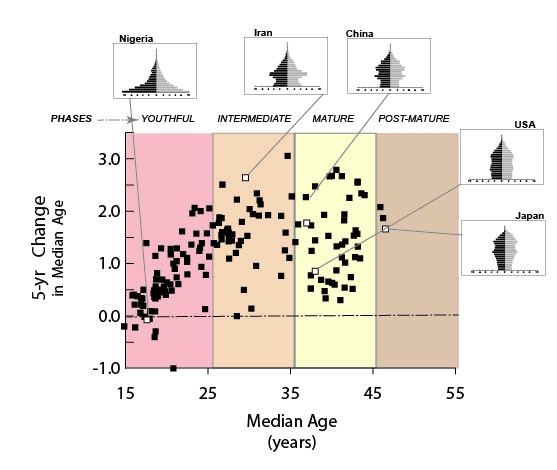
The Course of the Age-structural transition. 

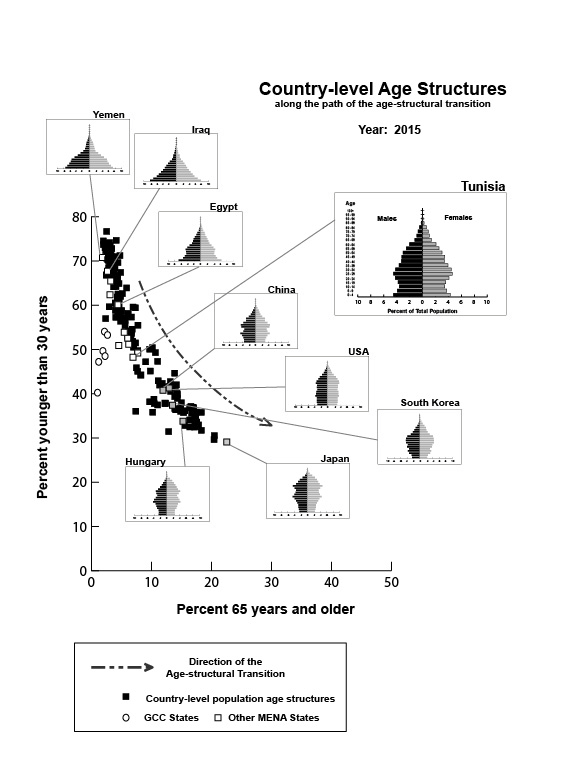
Figure 1.  The course of the age-structural transition is pictured by positioning the world’s states (in 2015) in terms of their proportion of young people (less than 30 years of age) and seniors (65 and older).


Initiated by fertility decline, the age-structural transition entails gradual shifts in the relative size of age cohorts through a lengthy, relatively predictable series of configurations. The Age-structural Theory of State Behavior owes much of its predictive potential to: (a.) the power of these configurations to influence, amplify, control, and reflect, a broad range of interacting demographic, social and economic conditions; and (b.) the ability of demographers to predict future configurations using cohort component methodologies.

To describe the age-structural transition (Fig. 1) with some narrative clarity, I employ the classification system published in the (U.S.) National Intelligence Council’s Global Trends series of publications (National Intelligence Council [NIC], 2012, 2017). Although the age-structural transition is continuous, this system intuitively divides the transition into four discrete phases, based on country-level median age (the age of the “middle person”, for whom 50 percent of the population is younger): the youthful; intermediate; mature; and post-mature phases.

Why does Age-structural Theory provide a useful estimate of the current and future behaviors of states?  Clearly, there is more to political action and risk than a country’s demography (isn’t there?).  Indeed, there is. However, the chain of causality that ends in intra-state conflict, democracy, or economic development is varied and complex. Using population age structure, analysts can take a step back and take a statistical view of state behavior, moving away from the close-up determinism that typically pervades country analyses.  An analysis using age structure reflects the state of a system of mutually re-enforcing effects that move between fertility decline (which drives age-structural change), educational attainment and income (Fig. 2). And, because the UN Population Division projects the configurations of every country’s age structure into the foreseeable future (and, some would argue, beyond it), age-structural models, which have been developed with past data, can be applied to the future.

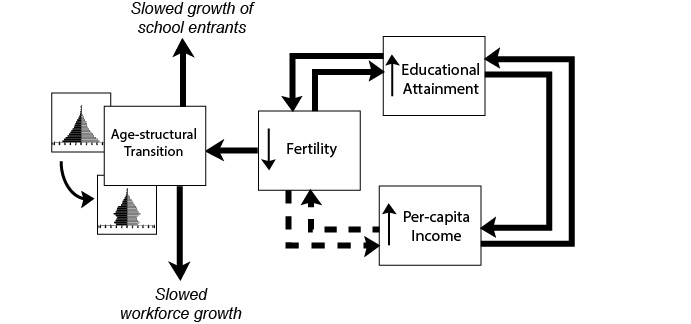
Figure 2.  A graphic representation of the feedbacks that ultimately drive age-structural change.


Attachments

The Four Age-structural Phases

The four age-structural phases are described in the (U.S.) National Intelligence Council’s Global Trends reports (2008, 2012, 2016). The phases (youthful, intermediate, mature, and post-mature) are described by ranges of median age (the age of the person in the population for whom precisely 50.00 percent of the population is younger). While no hard-and-fast borders exist between these categories, analysts find them useful for mapping and for narrative descriptions of conditions and processes.


The four age-structural phases. From left to right, they are youthful, intermediate, mature and post-mature. The graph shows the positions of of the world’s states in 2015, in terms of median age, and the 5-year rate of change in median age (2010 to 2015). 

The path of the age-structural transition can be described as a non-linear influence on state capacity—in colloquial terms, a “bad-news, good-news, bad-news” story (Cincotta, 2012). Countries in the earliest, high-fertility portion of the transition experience youthful age-structures that present obstacles to attaining high levels of institutional capacity and state legitimacy (Dyson, 2010). In the intermediate and mature phases, working-age adults proportionately dominate the population. Then, in the post-mature phase of the transition, population aging.

With more than half of their population composed of newborns, infants, school-age children, adolescents, and women in their peak childbearing years, demand for health and educational services in youthful states (so-called youth-bulge countries, median age <25.50 years) typically outstrips the state’s institutional capacity. Because annual growth rates among youth cohorts run high, children typically face school placement insufficiency and crowding, and low levels of societal investment per pupil (Lee & Mason, 2011). Meanwhile, young adults in these countries typically endure intense competition for jobs and underemployment (Easterlin, 1968). Politically difficult to manage, youthful populations tend to feature locally powerful extended family and patronage networks (Wusu & Isiugo-Abanihe, 2006), and an elevated risk of intra-state conflict and other forms of political violence (Goldstone, 2012; Urdal, 2006; Goldstone, 2002; Mesquida & Weiner, 1999; Möller, 1968).

The four age-structural phases experienced by Japan (1935, 1970, 1990, 2025 (projected).

Countries that advance into the intermediate phase of the age-structural transition (median age 25.50 to 35.49 years) experience lower proportions of their population among cohorts of dependent children, and higher proportions in the productive, and taxable, working ages (a worker bulge). This transformation, typically the result of fertility decline below 2.5 children per woman, has been associated with improvements in health status, increased per-child investment in schooling (Lee & Mason, 2011), growth in savings (Higgins & Williamson, 1997), increased participation of women in the economy (Bauer, 2001), and often a faster pace of economic development—what has been termed the “demographic dividend” (Bloom et al., 2002; Birdsall & Sinding, 2001).

Economic growth rates tend to slow as states enter the third phase of the age-structural transition, the mature phase (median age 35.50 to 45.49 years). Despite an aging workforce and a growing group of retirees in mature states, favorable economic and political conditions often prevail—a so-called “second demographic dividend” (Lee & Mason, 2006), a situation typically associated with states that amassed human capital during the intermediate phase.

In the final phase of the age-structural transition, states incur another challenging set of distributions: a series of post-mature age structures (median age 45.50 or greater) characterized by a large proportion of seniors and dependent elderly, and declining numbers in the younger working ages. Whereas by 2016 only three states—Japan, Germany, and Italy—have entered this category, some researchers hypothesize that, as a group, future post-mature states will face declining per-capita productivity, fiscal imbalances (Jackson & Howe, 2008), substantial foreign debt (Eberstadt & Groth, 2010), and constrained participation in the international system (Haas, 2007).

Attachments