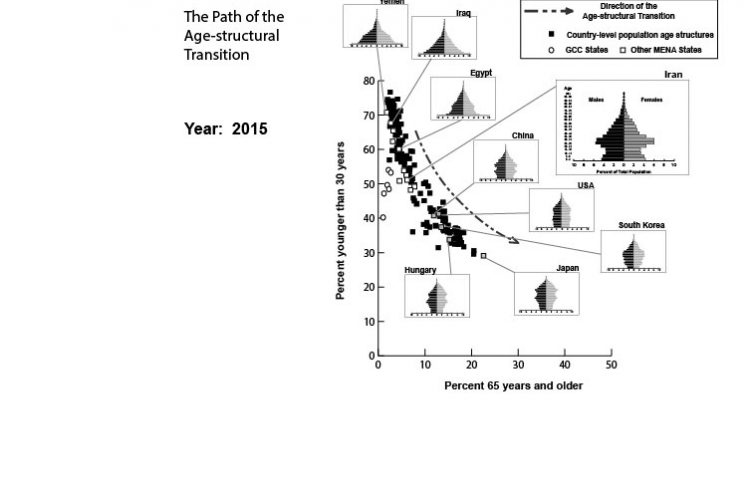
The Course of the Age-structural transition.
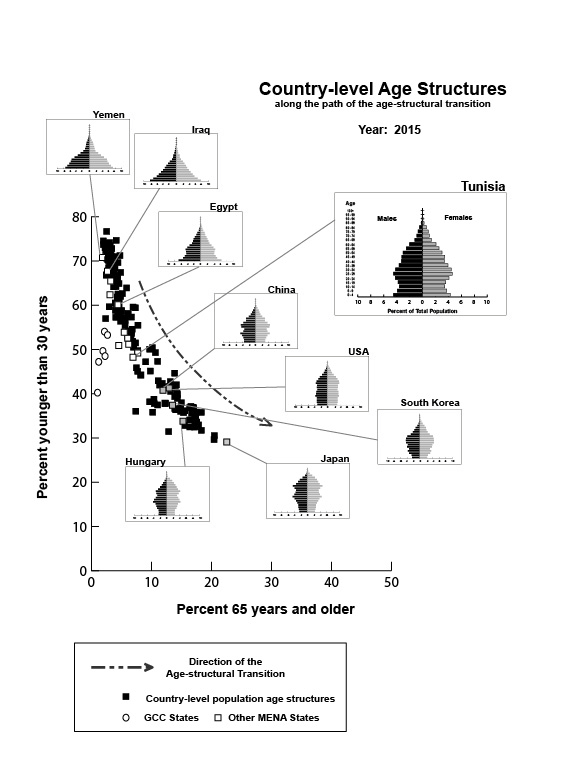
The course of the age-structural transition is pictured by positioning the world’s states (in 2015) in terms of their proportion of young people (less than 30 years of age) and seniors (65 and older).
Initiated by fertility decline, the age-structural transition entails gradual shifts in the relative size of age cohorts through a lengthy, relatively predictable series of configurations. The Age-structural Theory of State Behavior owes much of its predictive potential to: (a.) the power of these configurations to influence, amplify, control, and reflect, a broad range of interacting demographic, social and economic conditions; and (b.) the ability of demographers to project future configurations using cohort component methodologies.
To describe the age-structural transition with some narrative clarity, I employ the classification system published in the (U.S.) National Intelligence Council’s Global Trends series of publications (National Intelligence Council [NIC], 2012, 2017). This system divides the transition into four distinct phases, based on country-level median age (the age of the “middle person”, for whom 50 percent of the population is younger): the youthful; intermediate; mature; and post-mature phases.
However, the age-structural transition is a continuous process. It is advanced by fertility decline and by higher rates of survival at old age. However, median ages can become younger as childhood mortality declines in the absence of fertility decline. The impact of migration on the age structure depends upon the age-structure of the in-migrants and out-migrants.