Minority Youth Bulges and State Stability
 Read about Ethnodemographic Differences and majority-minority relations (first posted in The New Security Beat, 2012). Since its appearance, this two-by-two model of sub-state demographic differences has been increasingly used as a means of spotting escalating ethnic tensions and warning of future armed conflicts.
Read an application of the model (Barnhart et al., 2015, “The Refugee Crisis in the Levant”); and others by Rachel Blomquist on Myanmar’s Rohingya conflict (Fall, 2016; Spring, 2016).
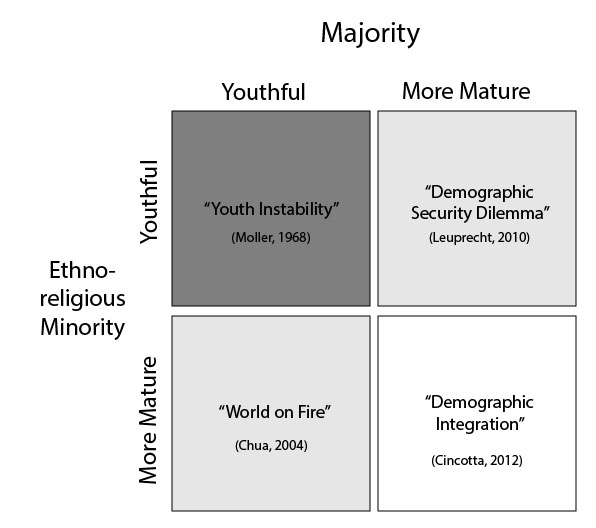
Figure 1. Two-by-two sub-state model of majority-minority relations, based on the age structural configurations of the majority and a politically organized minority population. Where there is no external interference, the “demographic integration” condition is hypothesized to be the most politically stable.