
Statistical predictions can be made from can be made from simple curves (see Figure below for Tunisia). This brief essay shows how drawing a line through a set of age structural functions (functions that describe the shift in a categorical probabilities over the age-structural transition) yields a set of probabilities for each category. To see how it’s done for child survival, per-capita income, and liberal democracy, and to see the predicted outcomes for Tunisia, Colombia, Bangladesh (this one is surprising!), Uzbekistan, Philippines, and Nigeria, click here or go to the “Individual State Forecasts” page in the Forecasts menu.
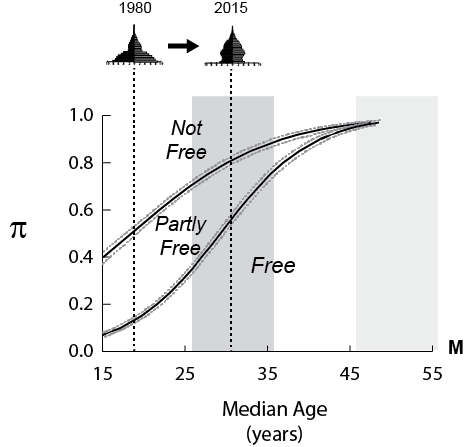
Fig. 1. Tunisia’s path, from 1980 to 2015, to a higher probability of being assessed as Free in Freedom House’s annual survey of political rights and civil liberties. Once in the demographic window (the intermediate phase, shaded in dark grey), the chances of retaining Free are much higher than in the preceding youthful phase.