The Region’s Demography and Its Implications by 2045 (Atlantic Council, 2021)
By Richard Cincotta and Stephen Smith
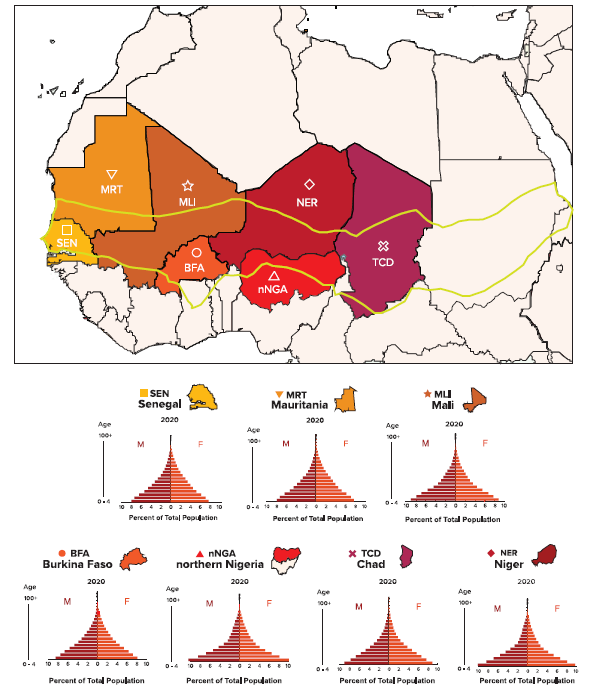
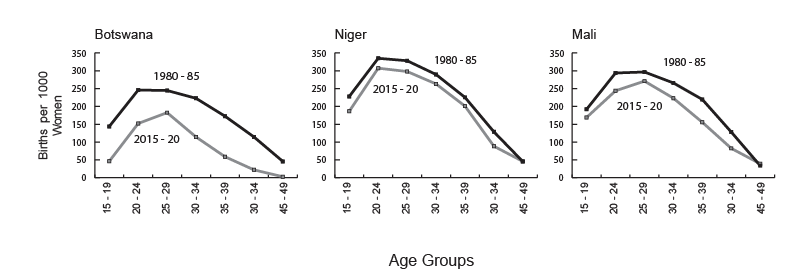
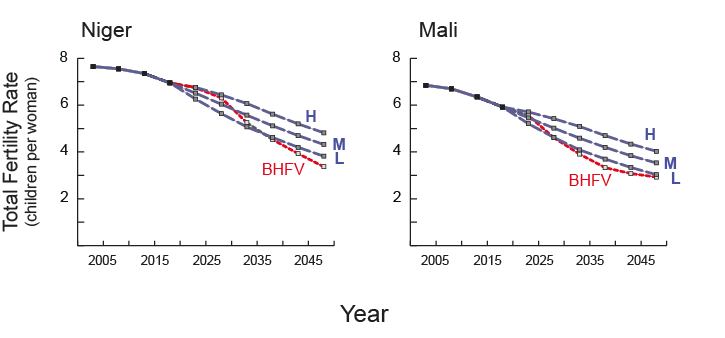
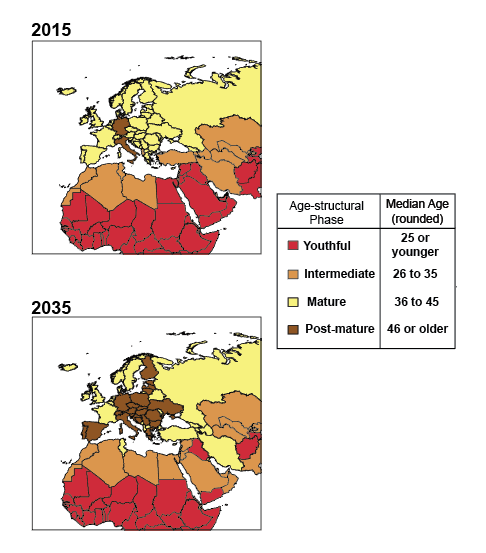
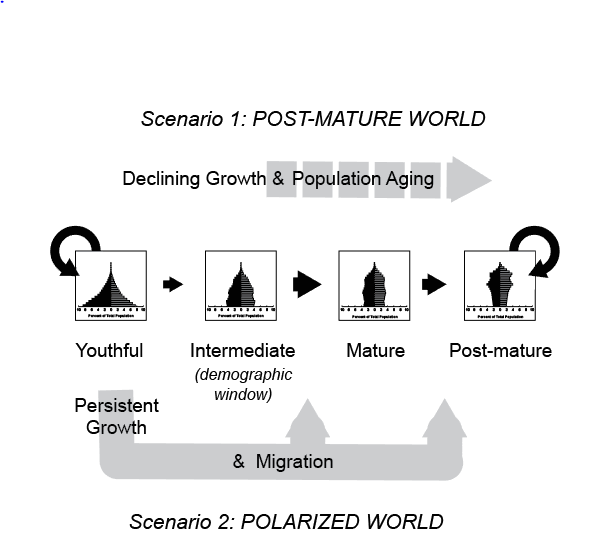
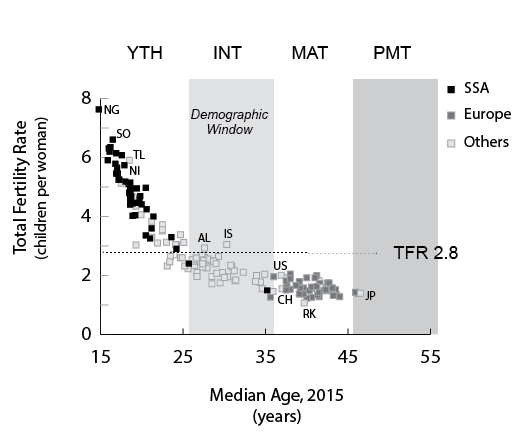
The Western Sahel—a region stretching from Senegal and Mauritania to Mali, Burkina Faso, Niger, and Chad, and including the twelve sharia law states of northern Nigeria—is in a demographic impasse. Rather than yielding an economic dividend, the conditions spawned by the region’s persistently youthful, rapidly growing, high-fertility populations overwhelm the capabilities of state-run services, generate extensive urban slum conditions, slow if not stall economic and social progress, and aggravate ethnic tensions. Decades of exposure to these mutually reinforcing conditions have undermined the legitimacy of central governments and rendered the region’s states vulnerable to the spread of Islamic populism and regime instability. For more …..
To view the report online: go here.
To view the Executive Summary, go to the Atlantic Council website
To download the report in .pdf format: download here