Sub-Saharan Africa: Looking Toward the Demographic Window

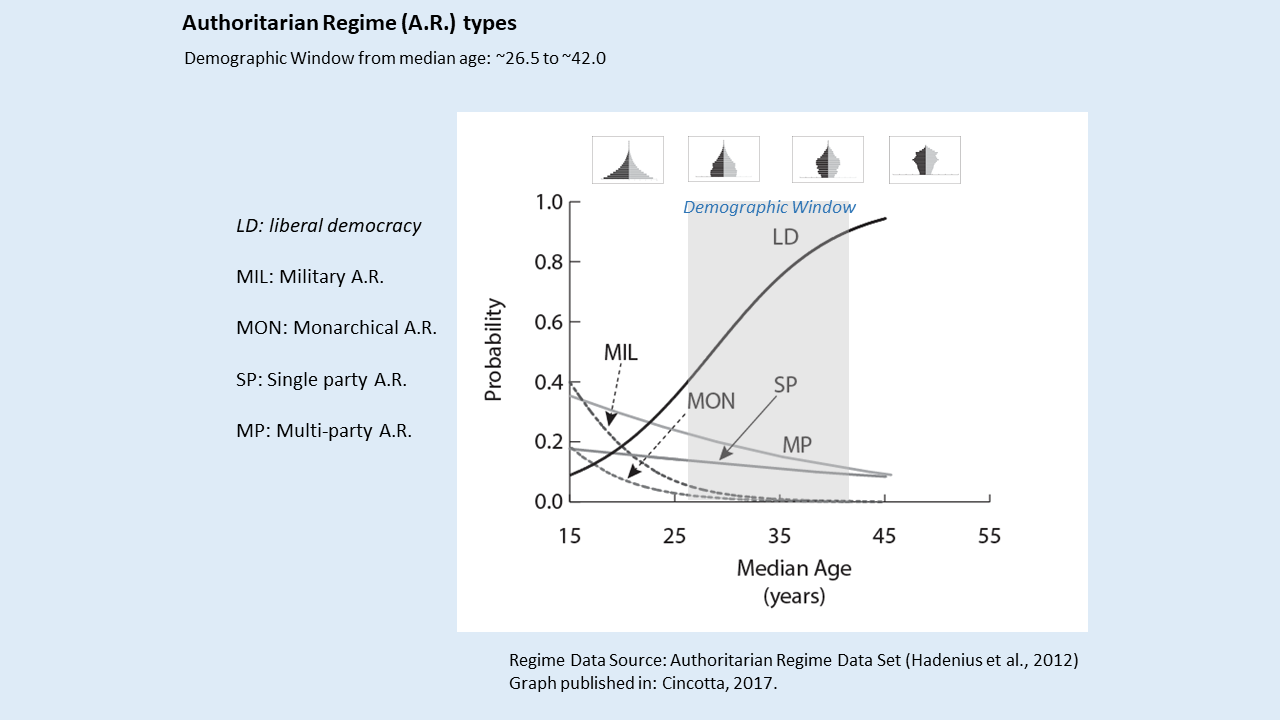
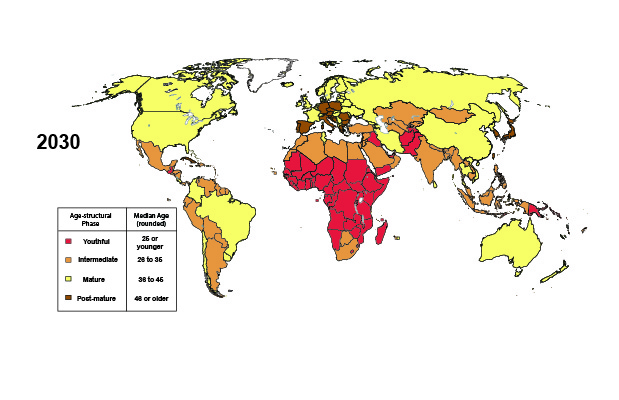
Over the past 25 years, economic and political demographers have focused on documenting the improvements in state capacity and political stability that have been realized in the wake of fertility declines in much of East Asia, Latin America, and most recently in the Maghreb of North Africa (Tunisia, Morocco, Algeria). Nonetheless, foreign affairs, defense and intelligence analysts still seem confused over when and where this demographic dividend should occur—and whether the youthful, low-income states of Sub-Saharan Africa are due to experience the dividend’s economically favorable age structures anytime soon. Because two very different development narratives vie for these analysts’ attention, their confusion is not that surprising.

     In this essay, I discuss the concept of “the demographic window” and compare economists’ perspectives on sub-Saharan Africa to that of political demographers.  I also identify 4 groups of countries in sub-Saharan Africa that have very different schedules for reaching the demographic window (and thus reaching the World Bank’s upper middle income category and other development milestones). For the entire essay, posted in the Woodrow Wilson Center’s New Security Beatsee this page.

Download this New Security Beat essay on Sub-Saharan Africa’s Demographic Window .

Article: Oxford Research Encyclopedia of Politics

The Age-structural Theory of State Behavior

Richard Cincotta

ABSTRACT: Over the past three decades, economic and political demographers, using various measures, have discerned that increased age-structural maturity makes significant statistical contributions to levels of per capita income, to educational attainment, to declines in the frequency of onsets of intrastate conflict, and to the likelihood of achieving and maintaining liberal democracy. Some of the stronger statistical relationships have been used in forecasts. For example, using the United Nations Population Division (UNPD) demographic projections, political demographers have relied on the strong statistical association between age structure and stable liberal democracy to forecast the rise of democracy in North Africa more than two years in advance (in 2008)—at a time when regional experts believed that forecast to be absurd.

Whereas critics remain skeptical of the murky causal connections of age-structural theory, its proponents counter that causality in the development of state capacity is complex and is less important than the theory’s positive qualities (namely, that it is forward-looking, its statistical findings are easily repeated, its forecasts have out-competed regional experts, and its predictive products can be readily adapted to the needs of intelligence foresight, defense planning, and foreign policy analysis). Perhaps most important, the age-structural theory of state behavior has yielded a surprising number of “novel facts”—new knowledge concerning the observed pace and timing of state political, social, and economic behaviors.

Full article is published in: 

Cincotta, R. (2017) “The Age-structural Theory of State Behavior.” In William Thompson (Ed.), Oxford Research Encyclopedia: Politics, Oxford Univ. Press. DOI: 10.1093/acrefore/9780190228637 .013.327;

The full article is downloadable here or request article from author (click here).

And it is available as a web article at the Oxford Research Encyclopedia site, at Oxford University Press.

Attachments

Political Demography in the NIC’s Global Trends publications

Early advances in age-structural political demography were pioneered within the (U.S.) National Intelligence Council’s Long-range Analysis Unit (now called “Strategic Futures”). That work has continued through collaborations between the NIC and political demographers. Some of the NIC’s political demography products are featured in three of hte NIC’s quadrennial strategic foresight series, entitled Global Trends.

Political demography can be found in the following sections in these 3 Global Trends publications, beginning in 2008:

Global Trends 2025, A Transformed World (published 2008):  Chapter 2: the Demographics of Discord, pp. 19-26.

Global Trends 2030, Alternative Worlds (published 2012)MEGATREND 3, Demographic Patterns, pp. 20-29.

Global Trends: Paradox of Progress (published 2016)People, pp. 161-166.

Age-structural functions: their directionality and punctuality

What is an Age-structural Function?

    An age-structural function is a two-dimensional graphic form of an age-structural model. This function describes a range (Y-axis) of probabilities of being within a category at all points (median ages) across the age-structural domain (the X-axis of the graph). To neatly capture nearly all recent positions in the age-structural transition, now and in the foreseeable future, the standard form of this graph extends over a domain that begins at a median age of 15 years and ends at 55 years. This standardized form is not perfect. Over the course of UN Population Division (UNPD) estimates (1950 to 2015), the populations of a few states (including Niger in 2015) have experienced median ages below 15.0 years. On the high side of the domain, however, no country-level age structure has yet gone beyond a median age of 48. Nonetheless, the UN Population Division projects that Japan will reach a median age higher than 50 years before 2030, and that several European and additional East Asian countries will follow it into the post-mature phase (a median age of 45.6 or higher) soon thereafter.

Not all age-structural functions that are fit to data by an age-structural model are qualitatively similar. Age-structural functions have been categorized into three qualitative classes (I, II, III), according to the conditions associated with the age-structural function that they describe (Fig. 1). These conditions influence the form and fit of the age-structural function.[i]

These three classes suggest differences in the strength of the relationship’s directionality and punctuality. Functional directionality can also be expressed as the ratio between the frequency at which it advances into a category, relative to the frequency at which it retreats back into this category. Class I age-structural functions (such as income and education functions) express high ratios of directionality and feedback between the indicator and movement along the age structural transition (or fertility decline). Class III functions (such as the frequency of intra-state conflict or the initiation of intra-state conflict) typically express low ratios. Class II functions (such as being assessed as Free in Freedom House’s annual survey) are like class I functions, but not as directional. States backslide more often, and there may be very little feedback, if any, associated with the relationship. Functional punctuality measures the tendency for advancement to be associated with a particular median age. This quality can be measured by the steepness of the curve (i.e., value of first derivative) at its inflection point (where p=0.50). Class I age-structural functions are most punctual; class III, the least.


Figure 1. Three classes of age-structural function (I, II, III). Each is associated with a particular set of dynamics exhibited by states, in terms of a categorical dependent variable (Y), over the length of the age-structural domain (X axis).


[i] Cincotta, R. 2017. “The Age-structural Theory of State Behavior.” in Oxford Reference Encyclopedia: Empirical International Relations Theory, edited by W. Thompson. Oxford: Oxford University Press. Download here.

Majority – Minority Ethnodemographic Differences

Minority Youth Bulges and State Stability


Read about Ethnodemographic Differences and majority-minority relations (first posted in The New Security Beat, 2012).  Since its appearance, this two-by-two model of sub-state demographic differences has been increasingly used as a means of spotting escalating ethnic tensions and warning of future armed conflicts.

Read an application of the model (Barnhart et al., 2015, “The Refugee Crisis in the Levant”); and others by Rachel Blomquist on Myanmar’s Rohingya conflict (Fall, 2016; Spring, 2016).


Figure 1. Two-by-two sub-state model of majority-minority relations, based on the age structural configurations of the majority and a politically organized minority population. Where there is no external interference, the “demographic integration” condition is hypothesized to be the most politically stable.


Attachments