Stressing Prediction Over Causality

Age-structural Theory’s Overt Focus on Predictions


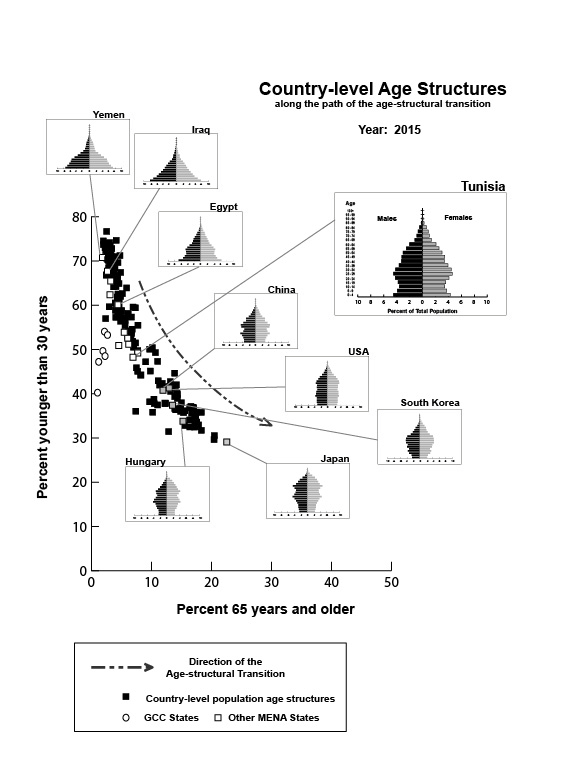
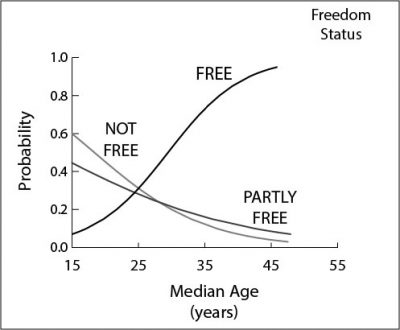
Rather than focusing on explanatory narratives and causality, the Age-structural Theory of State Behavior is concerned with generating “timed expectations.” At the core of this theory lies the age-structural transition—the continuous path of cohort re-configuration that leads from a youthful population, to one numerically dominated by middle-age adults and seniors. Age-structural Theory’s most tested models and functional forms are built upon this fundamental demographic process.

The body of Age-structural Theory is growing. At the leading edge of age-structural research is an expanding set of newly generated models, each reflecting a hypothesized relationship between the known position of states in this transition, and their corresponding likelihood of being observed in a specific political, social, or economic condition. In time, some of these hypothetical models will undoubtedly become more deeply woven into Age-structural Theory—but only if successful forecasts and other out-of-sample tests show them worthy of greater certainty, and if they are found analytically useful or create “new insights” into the relationships that they portray.

Forecasting is integral to Age-structural Theory. To investigate the future, age-structural models are simply re-positioned one or two decades into the future—into a demographic future already described in detail by the UN Population Division’s (UNPD’s) series of demographic projections (United Nations, Department of Economic and Social Affairs, Population Division [UNPD], 2015). Since age-structural models were first generated in 2008, this method has yielded a string of successful forecasts, discerning a “window of time” for future events and oncoming conditions that regional and country experts missed or thought were improbable. Moreover, several of the early conclusions of age-structural models—that states with youthful populations are vulnerable to political violence and experience difficult political and social environments for achieving and maintaining democracy—are increasingly accepted as fact by many foreign affairs policymakers.

The Course of the Age-structural Transition

The Course of the Age-structural transition. 

Figure 1.  The course of the age-structural transition is pictured by positioning the world’s states (in 2015) in terms of their proportion of young people (less than 30 years of age) and seniors (65 and older).


Initiated by fertility decline, the age-structural transition entails gradual shifts in the relative size of age cohorts through a lengthy, relatively predictable series of configurations. The Age-structural Theory of State Behavior owes much of its predictive potential to: (a.) the power of these configurations to influence, amplify, control, and reflect, a broad range of interacting demographic, social and economic conditions; and (b.) the ability of demographers to predict future configurations using cohort component methodologies.

To describe the age-structural transition (Fig. 1) with some narrative clarity, I employ the classification system published in the (U.S.) National Intelligence Council’s Global Trends series of publications (National Intelligence Council [NIC], 2012, 2017). Although the age-structural transition is continuous, this system intuitively divides the transition into four discrete phases, based on country-level median age (the age of the “middle person”, for whom 50 percent of the population is younger): the youthful; intermediate; mature; and post-mature phases.

Why does Age-structural Theory provide a useful estimate of the current and future behaviors of states?  Clearly, there is more to political action and risk than a country’s demography (isn’t there?).  Indeed, there is. However, the chain of causality that ends in intra-state conflict, democracy, or economic development is varied and complex. Using population age structure, analysts can take a step back and take a statistical view of state behavior, moving away from the close-up determinism that typically pervades country analyses.  An analysis using age structure reflects the state of a system of mutually re-enforcing effects that move between fertility decline (which drives age-structural change), educational attainment and income (Fig. 2). And, because the UN Population Division projects the configurations of every country’s age structure into the foreseeable future (and, some would argue, beyond it), age-structural models, which have been developed with past data, can be applied to the future.

Figure 2.  A graphic representation of the feedbacks that ultimately drive age-structural change.


Attachments

The Four Age-structural Phases

The four age-structural phases are described in the (U.S.) National Intelligence Council’s Global Trends reports (2008, 2012, 2016). The phases (youthful, intermediate, mature, and post-mature) are described by ranges of median age (the age of the person in the population for whom precisely 50.00 percent of the population is younger). While no hard-and-fast borders exist between these categories, analysts find them useful for mapping and for narrative descriptions of conditions and processes.


The four age-structural phases. From left to right, they are youthful, intermediate, mature and post-mature. The graph shows the positions of of the world’s states in 2015, in terms of median age, and the 5-year rate of change in median age (2010 to 2015). 

The path of the age-structural transition can be described as a non-linear influence on state capacity—in colloquial terms, a “bad-news, good-news, bad-news” story (Cincotta, 2012). Countries in the earliest, high-fertility portion of the transition experience youthful age-structures that present obstacles to attaining high levels of institutional capacity and state legitimacy (Dyson, 2010). In the intermediate and mature phases, working-age adults proportionately dominate the population. Then, in the post-mature phase of the transition, population aging.

With more than half of their population composed of newborns, infants, school-age children, adolescents, and women in their peak childbearing years, demand for health and educational services in youthful states (so-called youth-bulge countries, median age <25.50 years) typically outstrips the state’s institutional capacity. Because annual growth rates among youth cohorts run high, children typically face school placement insufficiency and crowding, and low levels of societal investment per pupil (Lee & Mason, 2011). Meanwhile, young adults in these countries typically endure intense competition for jobs and underemployment (Easterlin, 1968). Politically difficult to manage, youthful populations tend to feature locally powerful extended family and patronage networks (Wusu & Isiugo-Abanihe, 2006), and an elevated risk of intra-state conflict and other forms of political violence (Goldstone, 2012; Urdal, 2006; Goldstone, 2002; Mesquida & Weiner, 1999; Möller, 1968).

The four age-structural phases experienced by Japan (1935, 1970, 1990, 2025 (projected).

Countries that advance into the intermediate phase of the age-structural transition (median age 25.50 to 35.49 years) experience lower proportions of their population among cohorts of dependent children, and higher proportions in the productive, and taxable, working ages (a worker bulge). This transformation, typically the result of fertility decline below 2.5 children per woman, has been associated with improvements in health status, increased per-child investment in schooling (Lee & Mason, 2011), growth in savings (Higgins & Williamson, 1997), increased participation of women in the economy (Bauer, 2001), and often a faster pace of economic development—what has been termed the “demographic dividend” (Bloom et al., 2002; Birdsall & Sinding, 2001).

Economic growth rates tend to slow as states enter the third phase of the age-structural transition, the mature phase (median age 35.50 to 45.49 years). Despite an aging workforce and a growing group of retirees in mature states, favorable economic and political conditions often prevail—a so-called “second demographic dividend” (Lee & Mason, 2006), a situation typically associated with states that amassed human capital during the intermediate phase.

In the final phase of the age-structural transition, states incur another challenging set of distributions: a series of post-mature age structures (median age 45.50 or greater) characterized by a large proportion of seniors and dependent elderly, and declining numbers in the younger working ages. Whereas by 2016 only three states—Japan, Germany, and Italy—have entered this category, some researchers hypothesize that, as a group, future post-mature states will face declining per-capita productivity, fiscal imbalances (Jackson & Howe, 2008), substantial foreign debt (Eberstadt & Groth, 2010), and constrained participation in the international system (Haas, 2007).

Attachments

The NIC’s Four Age-structural Phases

The four age-structural phases are described in the (U.S.) National Intelligence Council’s Global Trends reports (2008, 2012, 2016). The phases (youthful, intermediate, mature, and post-mature) are described by ranges of median age (the age of the person in the population for whom precisely 50.00 percent of the population is younger). While no hard-and-fast borders exist between these categories, analysts find them useful for mapping and for narrative descriptions of conditions and processes.

The four age-structural phases. From left to right, they are youthful, intermediate, mature and post-mature. The graph shows the positions of of the world’s states in 2015, in terms of median age, and the 5-year rate of change in median age (2010 to 2015). 

The path of the age-structural transition can be described as a non-linear influence on state capacity—in colloquial terms, a “bad-news, good-news, bad-news” story (Cincotta, 2012). Countries in the earliest, high-fertility portion of the transition experience youthful age-structures that present obstacles to attaining high levels of institutional capacity and state legitimacy (Dyson, 2010). In the intermediate and mature phases, working-age adults proportionately dominate the population. Then, in the post-mature phase of the transition, population aging.

With more than half of their population composed of newborns, infants, school-age children, adolescents, and women in their peak childbearing years, demand for health and educational services in youthful states (so-called youth-bulge countries, median age <25.50 years) typically outstrips the state’s institutional capacity. Because annual growth rates among youth cohorts run high, children typically face school placement insufficiency and crowding, and low levels of societal investment per pupil (Lee & Mason, 2011). Meanwhile, young adults in these countries typically endure intense competition for jobs and underemployment (Easterlin, 1968). Politically difficult to manage, youthful populations tend to feature locally powerful extended family and patronage networks (Wusu & Isiugo-Abanihe, 2006), and an elevated risk of intra-state conflict and other forms of political violence (Goldstone, 2012; Urdal, 2006; Goldstone, 2002; Mesquida & Weiner, 1999; Möller, 1968).

The four age-structural phases experienced by Japan (1935, 1970, 1990, 2025 (projected).

Countries that advance into the intermediate phase of the age-structural transition (median age 25.50 to 35.49 years) experience lower proportions of their population among cohorts of dependent children, and higher proportions in the productive, and taxable, working ages (a worker bulge). This transformation, typically the result of fertility decline below 2.5 children per woman, has been associated with improvements in health status, increased per-child investment in schooling (Lee & Mason, 2011), growth in savings (Higgins & Williamson, 1997), increased participation of women in the economy (Bauer, 2001), and often a faster pace of economic development—what has been termed the “demographic dividend” (Bloom et al., 2002; Birdsall & Sinding, 2001).

Economic growth rates tend to slow as states enter the third phase of the age-structural transition, the mature phase (median age 35.50 to 45.49 years). Despite an aging workforce and a growing group of retirees in mature states, favorable economic and political conditions often prevail—a so-called “second demographic dividend” (Lee & Mason, 2006), a situation typically associated with states that amassed human capital during the intermediate phase.

In the final phase of the age-structural transition, states incur another challenging set of distributions: a series of post-mature age structures (median age 45.50 or greater) characterized by a large proportion of seniors and dependent elderly, and declining numbers in the younger working ages. Whereas by 2016 only three states—Japan, Germany, and Italy—have entered this category, some researchers hypothesize that, as a group, future post-mature states will face declining per-capita productivity, fiscal imbalances (Jackson & Howe, 2008), substantial foreign debt (Eberstadt & Groth, 2010), and constrained participation in the international system (Haas, 2007).

Attachments

Freedom House Freedom Status Categories

The Age-structural Model of Liberal Democracy [excerpted from Cincotta, R. 2015. “Who’s Next? Age Structure and the Prospects of Democracy and Conflict in North Africa and the Middle East.” in Population Change in Europe, the Middle-East and North Africa: Beyond the Demographic Divide, edited by K.N. Koenraad Matthijs, Christiane Timmerman, Jacques Haers, and Sara Mels. (Farnham, UK: Ashgate, 167-202)]. Also see: Cincotta, R. 2015. “Demography as Early Warning: Gauging Future Political Transitions in the Age-structural Time Domain.” Journal of Intelligence Analysis 22(2):129-148; Cincotta, R. “Will Tunisia’s Democracy Survive? A View from Political Demography“.

Fig. 1.  The relationship between median age (i.e., age-structural maturity) and the probability of being assessed as FREE by Freedom House. Estimates for PARTLY FREE and NOT FREE are shown as well.

Getting beyond a median age of 25 years clearly appears as a milestone for a modern state—and getting past 30 seems even better. At anytime over the past four decades, about half of all countries at a median age of 29 years have been assessed as FREE (i.e., median age 29 is known as FREE50). For countries that attain an intermediate age structure, approximately a third of the boost in liberal democracy can be credited to the “age-structural timing” of their ascent to liberal democracy, the other two-thirds are due to the increased stability as a liberal democracy (Fig. 1).  For states in which the population has entered the mature phase of the age-structural transition, the next older category, around 9 out of 10 states (87.8 +2.7 percent) have been assessed as FREE.

Nonetheless, some states achieve FREE before reaching a median age of 25 years. These youthful democracies typically risk losing FREE (becoming PARTLY FREE or NOT FREE) within a decade (Fig. 2).  Since these data were first generated, until now (2016), 62 states have dropped from FREE to another status. To date, only four of those losses have been above the crossing point of the two curves (point Alpha, Fig. 2): Thailand, Ukraine, Latvia and Estonia (the latter two recovered FREE within a year).

Fig. 2.  The probabilities of gaining FREE and losing FREE at different points in the age-structural transition (measured by median age). 

However, states can sometimes behave “more youthfully” than they mathematically appear. The persistence of significantly large, politically organized, youthful minorities in states with otherwise intermediate or mature populations appears to inhibit the ascent and stability of liberal democracy. The driver of this inhibition can take the form of political and civil discrimination against minorities or restrictions on civil liberties that are associated with ongoing intra-state conflict or post-conflict situations—the youthful minority being the focal point of conflict (examples include Sri Lanka during and after the 1983-2009 civil war, and Turkey’s conflict to the Kurdish southeast).

So far, getting “demographically older” has been good for democracy. It remains to be seen, however, whether this dictum will hold true for the European and East Asian states that are poised to advance, during the next two decades, into the post-mature phase of the age-structural transition. It would not be surprising if liberal democracies with post-mature populations were to experience difficulties maintaining their Free status. Advanced aging sets the stage for numerous plausible catalysts for such a retreat, including: rollbacks in the provision of vital services due to state indebtedness; social and political tensions between indigenous populations and more youthful migrants (where applicable); and ideological tensions over taxation and its allocation.

References

Cincotta, Richard P., and John Doces. “The Age-Structural Maturity Thesis: The Youth Bulge’s Influence on the Advent and Stability of Liberal Democracy.” In Political Demography: How Population Changes Are Reshaping International Security and National Politics, edited by Jack A. Goldstone, Eric Kaufmann and Monica Duffy Toft, 98-116. Basingstoke and New York: Palgrave-MacMillan, 2011. The steep slope of this relationship was initially studied with a linear model; for that work, see: Cincotta, R.P. 2008/09. “Half a Chance: Youth Bulges and Transitions to Liberal Democracy.” Environmental Change and Security Program Report 13:10-18 (this paper includes the 2008 prediction of liberal democracy in North Africa).

Attachments