Regional Forecasting Tables (RFTs)
RFTs provide analysts with a regional statistical summary at a glance–a graphic way to show how the states of a geographic region stack up against each other, both in terms of their statistical possibilities and statistical vulnerabilities.
To create an RFT, one needs a group of states that are sufficiently large (at least near 20 states, each with a population greater than 500,000) and sufficiently diverse (at least 15 years of median age between youngest and mature population).
The following RFTs are available on this website: Middle East-North Africa (MENA); North and South America (NSA); The Pacific Rim (PAC); East and Southern Africa (ESA); Central and South Asia (CSA); West and Central Africa and the Sahel (WCA); Europe (EUR). (for all 7 tables, see ALL).
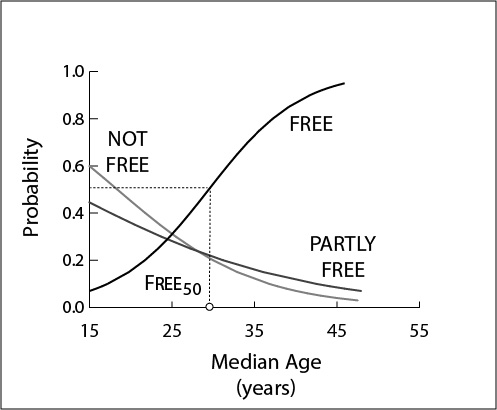
Figure 1. The functional form of the Age-structural Model of Liberal Democracy, showing Free50 positioned at the median age of 29 years.
The first step in creating an RFT is to order its countries (see Table 1, for the Middle East and North Africa). Using the UN Population Division’s most recent estimates and medium projections, RFTs are ordered (low to high) by their median age. They also list (in col. 6) the year that each country is estimated or projected to pass the median age of 29 years—a point identified as Free50. At Free50, 50.0 percent of countries have been assessed as FREE (generally used as an indicator of liberal democracy) in Freedom House’s annual assessment of civil liberties and political rights (see Fig. 1).
In the European Region’s table (EUR), all states have passed Free50. In this table, column 6 lists the year that each state will pass Free95–a median age of 45.5 (the beginning of the age-structural transition’s post-mature phase). At this point, the age-structural model gives states a 0.95 percent chance of being assessed as FREE.
How does one read an RFT? Using the following eight rules.
Analysts should expect :
- Expect states at the top of the list to experience the best chances of being assessed as Free in Freedom House’s annual survey (most analysts consider Free status to be synonymous with liberal democracy) (see Freedom House, Freedom in the World data);
- Expect states that have a youthful age structure (below a median age of 25.5 years) to be least likely to be assessed as Free, and most likely to be engaged in an intra-state conflict (of either low or high intensity, using UCDP/PRIO data base).
- Where revolutions occur in a state with a youthful population, expect either the authoritarian regime to remain in power, or to be replaced by another authoritarian regime (typically Not Free, or low-level Partly Free);
- Expect states that achieve Free while youthful to lose this rating within the next decade;
- Expect states with a population of less than 5.0 million to be the most likely to break rules 1, 2, 3, and 4 (see UN Population Division for annual population);
- Expect states that are ruled by an ideological single-party regime or another type of ideological political monopoly (for example, Iran’s theocracy), and thus to mature without liberalization (China, North Korea, Iran) (see Authoritarian Regimes Data Set for single-party and theocratic regime status);
- Expect states led by a revolutionary (Cuba under Castro, Venezuela under Chavez); or a charismatic reformer (Russia under Putin, Turkey under Erdogan, Singapore under Lee Kwan Yu) to resist attaining Free until that popular individual exits the political system.
- Expect states ruled by military juntas and absolute monarchs to yield to more liberal regimes before it attains a mature age-structure (before a median age of 35.5 years).
Below is a sample table, summarizing the Middle East-North Africa Region (MENA) in 2016 (20 states with populations over 500,000). Note that column 1, the current median age, orders the table from top (most mature age structure) to bottom (least mature). Columns 2 provides the UN Population Division’s medium fertility variant projection of the median age in 2025. Column 3 provides the name of the state. Column 4 provides the most recent end-of-year Freedom House score. Column 5 provides the current probability of being assessed FREE (according to the Age-structural Model of Liberal Democracy) by Freedom House. Column 6 provides the year at which the state’s population will pass the 50.0% probability of being assessed as FREE. Column 7 lists pertinent notes, including impediments to achieving FREE, and irregularities in the data or measures.
