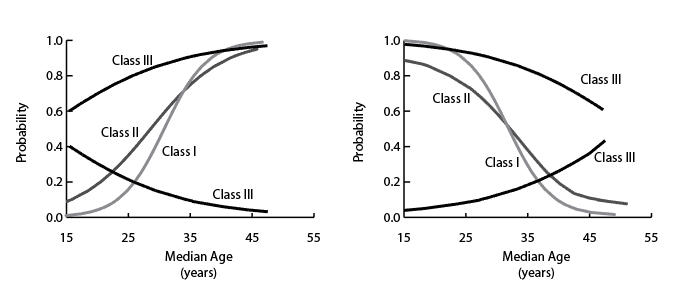
Age-structural Functions: Classes I, II, and III
A Class I Function: The World Bank’s Income Categories.
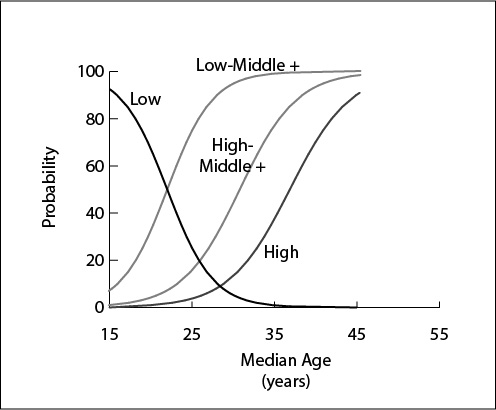
The World Bank Income Category Model (ASM-GNI) is composed of four class I age-structural functions that generate expectations of the age-structural timing of each of the World Bank’s standard income categories (Fig. 1). These categories are based on gross national income per capita (GNI per capita), calculated in current-year (or other standard year) US dollars using the World Bank’s Atlas Method (WB, 2016). States rarely slip from a higher to lower category.

Figure 1. Examples of Class I age-structural functions: the World Bank’s Income Categories. Class I functions depict the state’s attainment of a discrete level that is irreversible or nearly so.
GNI per capita (Atlas Method) data were transformed into four dependent variable data sets, each composed of presence of absence data (0,1). For the World Bank’s Low Income Category was transformed to indicate whether it was in the category (1), or not (0). For the following three higher categories (Lower-middle Income, Upper-middle Income, and High Income), GNI per capita data were transformed to identify whether the state was in the chosen category or a higher category (1), or in a lower category (0).
The functions displayed in this graph are the product of Model 2ac, which uses two statistically significant controls (p<0.05): small population size (<5.0 million), and reliance on oil or mineral resources (>15.0 percent of GDP). Thus controlled, relatively narrow 0.95 confidence intervals, reaching a maximum of +0.9 years on the median age axis at low median ages, surrounds each of the logistic functions.
While still untested by forecasting and experimentation, or examined in terms of the behavior of its exceptional states, the model reveals fresh aspects of the relationship between age structure and income. While it appears that states routinely achieve the World Bank’s Lower-middle Income category in the youthful phase of the age-structural transition (median age, <25 years), the results of modeling suggest that states must be well into the intermediate phase of the age-structural transition (thus attain fertility levels below 2.5 children per woman) to attain Upper-middle Income status—a milestone on the pathway to economic development at which development donors graduate countries from basic sectors of development.
Notably, the demographic window of opportunity—introduced by UNPD (2004) to estimate the period of greatest potential for economic development—coincides closely with the period when most states attain Upper-middle Income status. In its original formulation, the demographic window was calculated open when proportions of children, 0 to 14 years of age dipped below 30 percent of the total population, and seniors, 65 years and older, remained below 15 percent of the population. In the age-structural domain, that ranges from a median age of about 26 years to about 41 years.
A Class II Function: The Presence of Liberal Democracy.
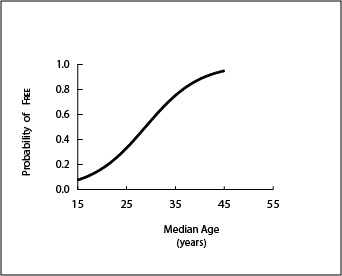
The age-structural model of liberal democracy (ASM-LD) generates timed expectations of the likelihood of being assessed at a high level of democracy across the age-structural axis (Fig. 2). The ASM-LD is the most well-studied of all age-structural functions, having been investigated by three independent research efforts, each using different measures of age structure (several variations of “youth bulge” measures, median age), and various indicators of democracy. Indications of democracy include Freedom House’s Free status (Cincotta 2008, 2008-09), high levels (8 to 10) of Polity IV regime scores (Cincotta & Doces, 2012; Weber, 2012), and high levels of voting as a proportion of eligible voters (Dyson, 2013). The conclusions were similar. Moreover, the ASM-LD is the subject of several successful forecasts and statistical experiments, which in turn have inspired additional hypotheses and modeling (Cincotta, 2008-09; Cincotta & Doces, 2012; Cincotta, 2015a, 2015b).

Figure 2. An example of a Class II function: the age-structural function depicting the probability of being assessed as FREE in Freedom House’s annual survey.
The functional form of the ASM-LD, shown here (Fig. 2), plots the timed expectation of attaining Free in Freedom House’s annual survey (Model 2ac, Table 1), as a probability calculated across the age-structural domain (Cincotta, 2015b). The most rapid pace of shifts to Free from lower categories should be expected to occur around the theoretical infliction point, where the probability of being assessed as Free is 0.50. This point, called Free50, is at about 29.5 (+0.5) years of median age.
A Class III Function: The Presence of Intra-state Peace.
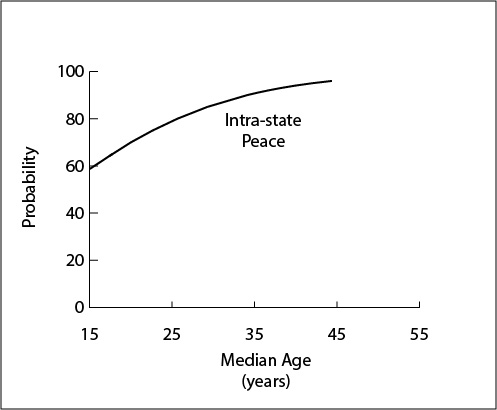
The Age-structural Model of Intra-state Peace (ASM-ISP) predicts the probability of the absence of intra-state conflict across the age-structural domain (Fig. 3). The model draws its data on the presence or absence of intra-state conflict (>25 battle-related deaths per year) from the UCDP-PRIO Conflict Database, maintained and published cooperatively by the Uppsala Conflict Database Project (UCDP) and Peace Research Institute of Oslo (PRIO) (UCDP/PRIO, 2016; Gleiditsch et al., 2002; Themnér & Wallensteen, 2013). Its function (Fig. 3) is a class III age-structural function, based upon the ASM-ISP, with controls for small population (<5.0 million), and natural resource reliance (resource rents <15.0 percent of GDP).

Figure 3. An example of a Class III function: the age-structural function of intra-state peace (absence of an intra-state conflict).
The ASM-ISP is neither a tightly fit nor strongly predictive model—its gradual slope is not conducive to forecasting. It is nonetheless useful in mapping states, now and over the next two decades, that are generally vulnerable to the outbreak of intra-state conflict and other forms of political violence. It is worth noting that, according to the ASM-IP, at a median age of 15.0 years, roughly 60 percent of all states are unlikely to be experiencing an intra-state conflict. Further investigations of the function indicate that while civil conflicts appear almost exclusively in the youthful portion of the age-structural domain (median age of 25 years or less), ethnoreligious conflicts extend throughout the domain (see Yair, 2016).

