Read “Population Aging: A Demographic and Geographic Overview” by Richard Cincotta, published in the National Intelligence Council’s Global Trends 2030 blog, and in the New Security Beat, July, 2012. Download “Population Aging: A Demographic and Geographic Overview” here …
This GT2030 blog, focused on population aging, begins with this introductory essay aimed at familiarizing readers with some of the demographic and geographic particulars of this phenomenon, and with several key demographic terms. The term most in need of definition is, of course, population aging. Strictly speaking, aging is any shift in the population’s age structure (the distribution of individuals, by age) that produces an increase in the median age (the age of the individual for whom one-half of the population is younger). Generally, advances in a population’s median age are associated with increases in the proportion of seniors (aged 65 years and older), and declines in the proportion of children (younger than 15). Sustained population aging leads to a relatively older workforce, slowed workforce growth and slowed growth among school-age children.
While various age-specific patterns of birth, death and migration can induce change in the median age, over the past century two demographic processes have contributed most powerfully to country-level population aging. First and foremost is declining fertility (fertility is usually measured by computing the total fertility rate (TFR), an immediate estimate of the numbe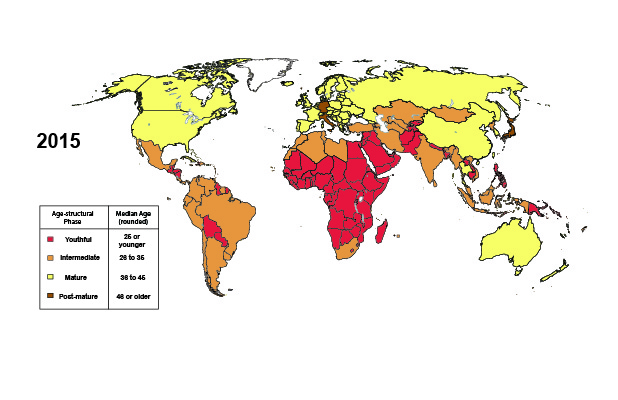 r of children that women are bearing over their reproductive lifetime). The second most influential factor has been increasing longevity. Not all trends associated with modernization, however, contribute to aging. Declines in childhood mortality have served to slow aging’s pace or make it retreat, as have waves of youthful immigrants (until the immigrants themselves age) and occasional baby booms.
Is an advance in the median age bad news? That depends on “where you are” the broad diversity of age structures suggested by today’s lengthy spectrum of median ages—which in 2012 stretches from around 16 years (Niger, Uganda, Mali) to around 45 (Japan, Germany). For states in the youthful phase of the age-structural transition (median age 25.4 years or less; see Figure 1), the near-term net economic, social, political outcomes of aging are overwhelmingly positive. Getting to the next next age-structural phase— the intermediate phase (25.5 to 35.4)—is crucial; it is associated with very high support ratios (working-age adults per child), diminished risk of intra-state conflict, the accumulation of human capital, and higher savings (am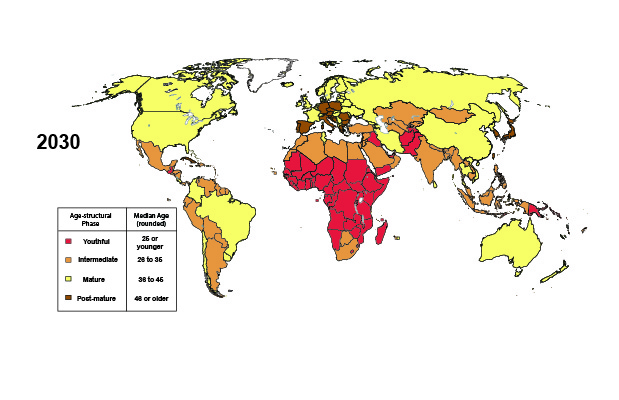 ong “saver” societies).
There are growing indications that states might develop more quickly by sustaining their intermediate phase—which, for very-low-fertility states, has been rather fleeting (for example, China recently departed the intermediate phase after entering 25 years ago). In fact, states that have achieved near-universal secondary education and sustained a lengthy period of economic prosperity and liberal-democratic stability, including the US, have done so during their population’s presence within the so-called age-structural sweet spot: starting in the their intermediate phase and finishing during the first half of the mature phase (the mature phase ranges from 35.5 to 45.4 years).
The forthcoming essays in this blog are focused “beyond the sweet spot.” It is concerned with the challenges and possible outcomes of “advanced aging”—a condition never before encountered—that will evolve in the so-called post-mature phase (median age >45.5 years) of the age structural transition. Countries approaching the end of the mature phase, most in Europe and East Asia, are accumulating large proportions of seniors, most of whom are moving out of the workforce, drawing on pensions, drawing down personal savings and other accumulated assets, and accepting transfers from their children, other relatives, and other public and non-profit sources. As they age, seniors face an increasing risk of morbidity due to chronic illness and declining physical mobility, as well as an increasing risk of poverty.
While improvements in healthcare and nutrition promise to compress the late-in-life period of high morbidity and permit the extension of workforce participation, the projected declines in the number of working-age adults per retiree (the old-age support ratio) in European and East Asian states over the coming two decades is unprecedented. These projections suggest that those states heading for a post-mature future need to deftly manipulate a full range of social and fiscal policy levers in order to mediate, and adapt to, the cost burdens that are poised to descend upon their pension and healthcare systems. Simultaneously, most of these states will likely wrestle with the challenging and politically delicate task of encouraging the reestablishment of near-replacement-level TFR.

The four age-structural phases experienced by Japan (1935, 1970, 1990, 2025 (projected).
As of 2012, only Japan and German have attained the 45-year median-age mark—and just within the past year or two. Significantly, both countries face “negative momentum”; in other words, because of several decades of annual TFRs below 1.5 children per woman and steadily increasing life expectancies, these and other very-low-fertility states are projected to continue to age for the foreseeable future—until old-age mortality dissipates their populations’ currently broad bulges of seniors and middle-agers, and fertility or migration significantly enlarges their childhood and young adult cohorts. In other words, advanced aging is not a momentary inconvenience.
By 2030, advanced aging will have spread widely through Europe (see figure 2: world maps, 2015 and 2030). Current projections by demographers at the US Census Bureau’s International Program Center (International Data Base, June 2011) suggest that the populations of 29 states (each over 1 million residents) will experience a median age over 45.0 years by 2030. Of these, the Census Bureau indicates that 26 will be located in Europe and 3 in East Asia (Japan, Taiwan and South Korea). Despite China’s rapid pace of aging, US Census Bureau projections place its 2030 median age at 43 years, very similar to the UN Population Division’s medium fertility-variant projection for the PRC. The UN Population Division, using a somewhat different set of projection assumptions to produce its medium fertility variant, projects that by 2030 this post-mature group of countries (median age >45.0 years) will consist of 19 states: 14 European, 4 East Asian (including Singapore), and Cuba.
Richard Cincotta is Demographer-in-residence at the Stimson Center in Washington, DC, and a consultant on political demography for the Woodrow Wilson Center’s Environmental Change and Security Program. From 2006-09, he served as a long-range analyst for the (U.S.) National Intelligence Council.


