Minority Youth Bulges and the Future of Intrastate Conflict

Read “Minority Youth Bulges and the Future of Intrastate Conflict,” by Richard Cincotta, posted in the New Security Beat on October 13, 2011. The sub-state demographic theory of the risk of ethnoreligious conflict described in this essay has been applied to several countries. See “The Refugee Crisis in the Levant” (Barnhart et al., 2015, American U.), and The Demography of the Rohingya Conflict (Blomquist & Cincotta, 2015), and the Ethno-demographic Dyanmics of the Rohingya Conflict.

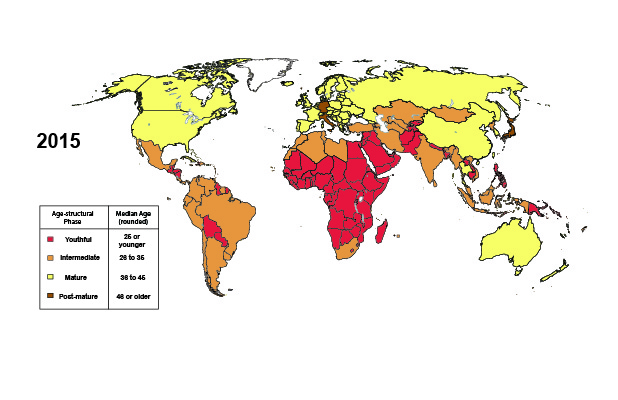
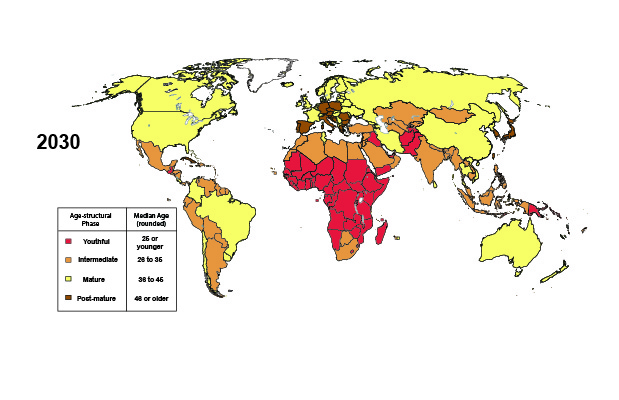
From a demographic perspective, the global distribution of intrastate conflicts is not what it used to be. During the latter half of the 20th century, the states with the most youthful populations (median age of 25.0 years or less) were consistently the most at risk of being engaged in civil or ethnoreligious conflict (circumstances where either ethnic or religious factors, or both, come into play). However, this tight relationship has loosened over the past decade, with the propensity of conflict rising significantly for countries with intermediate age structures (median age 25.1 to 35.0 years) and actually dipping for those with youthful age structures (see Figure 1 below).

Why has this relationship changed? At least two underlying trends help explain the shift:

  1. Over the last two decades, the deployment of peace support operations to countries with youthful populations has surged (described in a previous post on New Security Beat); and
  2. Ethnoreligious conflicts have gradually, though noticeably, increased among a group of states with a median age greater than 25.0 years (including Thailand, Turkey, and Russia).

Read the rest at …

Israel: Unpromising Demography in a Promised Land

Read the NIC occasional paper entitled, “Unpromising Demography in a Promised Land: The Growth of Dissonant Minorities and the Escalation of Demographic Politics in Israel,” written by Richard Cincotta and Eric Kaufmann (U. London) and published in 2010.

Israel’s demographic challenge is more complex and immediate than most Middle East analysts assume. Secular and religiously traditional Israeli Jews, both native-born and immigrant, upon whose Zionist hopes and political ideals Israel was founded and maintained, are experiencing a “demographic squeeze”–the rise of two dissonant ethnoreligious minorities: the Haredim (Ultra-Orthodox Jews), who typically harbor sympathies to the right; and Israeli Arabs, whose political sympathies lie largely to the left. With each passing year, Israeli Arabs and Haredim, both of whom express grievances with the Zionist political and sectarian order, assume a larger proportion of the country’s population.

Download the rest of this National Intelligence Council occasional paper “Israel: Unpromising Demography in a Promised Land” here

Creating Regional Forecasting Tables

Regional Forecasting Tables (RFTs)

RFTs provide analysts with a regional statistical summary at a glance–a graphic way to show how the states of a geographic region stack up against each other, both in terms of their statistical possibilities and statistical vulnerabilities.

To create an RFT, one needs a group of states that are sufficiently large (at least near 20 states, each with a population greater than 500,000) and sufficiently diverse (at least 15 years of median age between youngest and mature population).

The following RFTs are available on this website: Middle East-North Africa (MENA); North and South America (NSA); The Pacific Rim (PAC); East and Southern Africa (ESA); Central and South Asia (CSA); West and Central Africa and the Sahel (WCA); Europe (EUR). (for all 7 tables, see ALL).

Figure 1. The functional form of the Age-structural Model of Liberal Democracy, showing Free50 positioned at the median age of 29 years.

The first step in creating an RFT is to order its countries (see Table 1, for the Middle East and North Africa). Using the UN Population Division’s most recent estimates and medium projections, RFTs are ordered (low to high) by their median age.  They also list (in col. 6) the year that each country is estimated or projected to pass the median age of 29 years—a point identified as Free50.  At Free50, 50.0 percent of countries have been assessed as FREE (generally used as an indicator of liberal democracy) in Freedom House’s annual assessment of civil liberties and political rights (see Fig. 1).

In the European Region’s table (EUR), all states have passed Free50. In this table, column 6 lists the year that each state will pass Free95–a median age of 45.5 (the beginning of the age-structural transition’s post-mature phase). At this point, the age-structural model gives states a 0.95 percent chance of being assessed as FREE.

How does one read an RFT? Using the following eight rules.

Analysts should expect :

  1. Expect states at the top of the list to experience the best chances of being assessed as Free in Freedom House’s annual survey (most analysts consider Free status to be synonymous with liberal democracy) (see Freedom House, Freedom in the World data);
  2. Expect states that have a youthful age structure (below a median age of 25.5 years) to be least likely to be assessed as Free, and most likely to be engaged in an intra-state conflict (of either low or high intensity, using UCDP/PRIO data base).
  3. Where revolutions occur in a state with a youthful population, expect either the authoritarian regime to remain in power, or to be replaced by another authoritarian regime (typically Not Free, or low-level Partly Free);
  4. Expect states that achieve Free while youthful to lose this rating within the next decade;
  5. Expect states with a population of less than 5.0 million to be the most likely to break rules 1, 2, 3, and 4 (see UN Population Division for annual population);
  6. Expect states that are ruled by an ideological single-party regime or another type of ideological political monopoly (for example, Iran’s theocracy), and thus to mature without liberalization (China, North Korea, Iran) (see Authoritarian Regimes Data Set for single-party and theocratic regime status);
  7. Expect states led by a revolutionary (Cuba under Castro, Venezuela under Chavez); or a charismatic reformer (Russia under Putin, Turkey under Erdogan, Singapore under Lee Kwan Yu) to resist attaining Free until that popular individual exits the political system.
  8. Expect states ruled by military juntas and absolute monarchs to yield to more liberal regimes before it attains a mature age-structure (before a median age of 35.5 years).

Below is a sample table, summarizing the Middle East-North Africa Region (MENA) in 2016 (20 states with populations over 500,000).  Note that column 1, the current median age, orders the table from top (most mature age structure) to bottom (least mature). Columns 2 provides the UN Population Division’s medium fertility variant projection of the median age in 2025. Column 3 provides the name of the state. Column 4 provides the most recent end-of-year Freedom House score. Column 5 provides the current probability of being assessed FREE (according to the Age-structural Model of Liberal Democracy) by Freedom House. Column 6 provides the year at which the state’s population will pass the 50.0% probability of being assessed as FREE. Column 7 lists pertinent notes, including impediments to achieving FREE, and irregularities in the data or measures.


Attachments

Regional Forecasting Tables: The Rules of the Game

The Rules of the Game

Three types of rules help analysts interpret an Regional Forecasting Table (RFTs).

  • Trends. Age-structural trends are models that describe the chances of a state exhibiting a particular behavior (such as a regime type, engagement in an intra-state conflict, or attainment of a level of development) probability of a behavior continuously over the range of median ages (15 to 47 years). Trends describe the along the range of country-level median ages (15 to 47 years).
  • Conditions. These exceptional conditions allow states to defy the latter set of trends. In other words, they identify types of “rule breakers”.
  • Conjectures. Conjectures are preliminary hypotheses. Each is a candidate for ultimately becoming either an age-structural trend or an exceptional condition. However, each requires some degree of additional clarification and testing.

From a scientific perspective, all of political demography’s rules and conditions are hypotheses. Each could fail, be modified, rejected, or displaced by a better performer after a rigorous test or fundamental change in the relationships it describes.

Trends

Figure 1. The functional form of the Age-structural Model of Liberal Democracy, showing Free50 positioned at the median age of 29. [Trend 1]

Trend 1 [. States at the top of the table (higher median ages) should have a better chance of being a liberal democracy (assessed as FREE). Countries at the bottom of the list (lower median ages) are more likely to be assessed as NOT FREE or PARTLY FREE (see Fig. 1);

Trend 2. FREE states below a median age of 26 years to be prone to losing FREE (descending to assessments of PARTLY FREE or NOT FREE) within the following 10 years (Fig. 2).

Trend 3. states within the youthful portion of the list (below median age of 25.5 years), or near its edge, to the most vulnerable to the outbreak of intra-state conflict. As their population nears a median age of 30 years, they should also be expected to achieve the World Bank’s upper-middle income category (see Fig. 3) and settle civil conflicts, although ethnic conflicts with youthful minorities are likely to persist or intermittently recur.

Figure 2. The age-structural probabilities of gaining FREE and losing FREE, once assessed with FREE status. [Trend 2] 

Conditions.  Of course, there are exceptional conditions for which to watch out.

Condition 1 [Political Monopolies].  States under the control of political monopolistic regimes–single party states, like the remaining Marxist autocracies (e.g., China, North Korea, Vietnam, Cuba) or monolithic non-party states, like Iran’s theocracy, do not appear to “obey the rules.” Monopolistic regimes, particularly the most ideological of them, are difficult to dislodge. As their age structure matures, pressures to liberalize are repelled by ideologically justified suppression of dissent and intimidation. As the age structure matures, the chance for popular revolution typically declines, narrowing the possibility for reform to the emergence of a reformer within the ranks (a Gorbachev), or to external actors.

Condition 2 [Revolutionaries].  Revolutionaries and other charismatic reformers (Russia’s Vladimir Putin, Venezuela’s late-president, Hugo Chavez; Singapore’s late-president, Lee Kwan Yu) who tolerate an opposition, but have a large popular following, are also difficult to dislodge. Their regimes persist as long as they remain alive, and as long as they are able to designate an equally charismatic reformer–which rarely happens. While they may tolerate a weak opposition, they rarely allow a charismatic underling to rise within their own political organization (perhaps with the exception of one of their offspring). Thus, in the long run, their regimes are ultimately prone to change as their age structure matures.

Condition 3 [Small Populations].  States with relatively small populations (I use populations under 5.0 million) often over-perform. They are often “precociously” assessed as FREE, avoid intra-state conflict even as youthful populations, and often achieve the World Bank’s high-middle income category at younger median ages than more populace states (examples are: Costa Rica, Jamaica, Belize, Botswana, Guyana and the Solomon Islands).

Figure 3. The age-structural probabilities of NOT being in a intra-state conflict, and of being in the World Bank’s high-middle income category. [Trend 3] 

Condition 4 [Ongoing Ethnic Conflicts].  States that are involved in significant armed conflicts with ongoing ethnic conflicts or dysfunctional inter-ethnic politics often delay democratization (e.g., Colombia, Sri Lanka, Myanmar, Lebanon). Here, I control for states that have greater than 1,000 battle-related deaths per year, but it may be the case that states are sensitive to smaller conflicts.

Condition 5 [Resource Rentiers].  States that rely on oil or mineral wealth may have the wealth to control dissent and placate discontent, delaying democratization (Russia, the GCC states). I control for states where oil and mineral revenues amount to more than 15 percent of GDP.

Condition 6 [Military Regimes & Absolute Monarchies].  Expect states led by military authoritarians to cede rule to pro-democracy movements before the population age structure reaches the end of the intermediate phase (a median age less than 35.5 years). This constraint also appears to be true for absolute monarchies, perhaps with less certainty.

The following Regional Forecasting Tables are available on this website: Middle East-North Africa (MENA); Latin America and the Caribbean (LAC); The Pacific Rim (PAC); East and Southern Africa (ESA); Central and South Asia (CSA); West and Central Africa and the Sahel (WCA); Europe (EUR).


Conjectures

Conjectures are promising hypotheses, but need considerably more research.

Conjecture 1 [Spillover Hypothesis].  Contiguous pairs and clusters of states with youthful populations risk “spillovers”–conditions under which the insurgency involved in intra-state conflicts crosses borders, affecting adjacent states and relations between states (examples: Taliban in Pakistan and Afghanistan; ISIS in Iraq and Syria; Al Qaida, ISIS, Boko Haram in the Sahel).

Conjecture 2 [Populism Hypothesis]. The coupling of age-structural maturity and immigration appears to be associated with the rise of populist political contenders and receding Freedom scores. If this hypothesis is viable, then analysts may see receding levels of Freedom Scores among post-mature states, and perhaps fewer numbers of FREE among them in the future.

Attachments

2015: Country-level age structures

Read “Population Aging: A Demographic and Geographic Overview” by Richard Cincotta, published in the National Intelligence Council’s Global Trends 2030 blog, and in the New Security Beat, July, 2012. Download “Population Aging: A Demographic and Geographic Overview” here …

This GT2030 blog, focused on population aging, begins with this introductory essay aimed at familiarizing readers with some of the demographic and geographic particulars of this phenomenon, and with several key demographic terms. The term most in need of definition is, of course, population aging. Strictly speaking, aging is any shift in the population’s age structure (the distribution of individuals, by age) that produces an increase in the median age (the age of the individual for whom one-half of the population is younger). Generally, advances in a population’s median age are associated with increases in the proportion of seniors (aged 65 years and older), and declines in the proportion of children (younger than 15). Sustained population aging leads to a relatively older workforce, slowed workforce growth and slowed growth among school-age children.

While various age-specific patterns of birth, death and migration can induce change in the median age, over the past century two demographic processes have contributed most powerfully to country-level population aging. First and foremost is declining fertility (fertility is usually measured by computing the total fertility rate (TFR), an immediate estimate of the number of children that women are bearing over their reproductive lifetime). The second most influential factor has been increasing longevity. Not all trends associated with modernization, however, contribute to aging. Declines in childhood mortality have served to slow aging’s pace or make it retreat, as have waves of youthful immigrants (until the immigrants themselves age) and occasional baby booms.

Is an advance in the median age bad news? That depends on “where you are” the broad diversity of age structures suggested by today’s lengthy spectrum of median ages—which in 2012 stretches from around 16 years (Niger, Uganda, Mali) to around 45 (Japan, Germany). For states in the youthful phase of the age-structural transition (median age 25.4 years or less; see Figure 1), the near-term net economic, social, political outcomes of aging are overwhelmingly positive. Getting to the next next age-structural phase— the intermediate phase (25.5 to 35.4)—is crucial; it is associated with very high support ratios (working-age adults per child), diminished risk of intra-state conflict, the accumulation of human capital, and higher savings (among “saver” societies).

There are growing indications that states might develop more quickly by sustaining their intermediate phase—which, for very-low-fertility states, has been rather fleeting (for example, China recently departed the intermediate phase after entering 25 years ago). In fact, states that have achieved near-universal secondary education and sustained a lengthy period of economic prosperity and liberal-democratic stability, including the US, have done so during their population’s presence within the so-called age-structural sweet spot: starting in the their intermediate phase and finishing during the first half of the mature phase (the mature phase ranges from 35.5 to 45.4 years).

The forthcoming essays in this blog are focused “beyond the sweet spot.” It is concerned with the challenges and possible outcomes of “advanced aging”—a condition never before encountered—that will evolve in the so-called post-mature phase (median age >45.5 years) of the age structural transition. Countries approaching the end of the mature phase, most in Europe and East Asia, are accumulating large proportions of seniors, most of whom are moving out of the workforce, drawing on pensions, drawing down personal savings and other accumulated assets, and accepting transfers from their children, other relatives, and other public and non-profit sources. As they age, seniors face an increasing risk of morbidity due to chronic illness and declining physical mobility, as well as an increasing risk of poverty.

While improvements in healthcare and nutrition promise to compress the late-in-life period of high morbidity and permit the extension of workforce participation, the projected declines in the number of working-age adults per retiree (the old-age support ratio) in European and East Asian states over the coming two decades is unprecedented. These projections suggest that those states heading for a post-mature future need to deftly manipulate a full range of social and fiscal policy levers in order to mediate, and adapt to, the cost burdens that are poised to descend upon their pension and healthcare systems. Simultaneously, most of these states will likely wrestle with the challenging and politically delicate task of encouraging the reestablishment of near-replacement-level TFR.

The four age-structural phases experienced by Japan (1935, 1970, 1990, 2025 (projected).

As of 2012, only Japan and German have attained the 45-year median-age mark—and just within the past year or two. Significantly, both countries face “negative momentum”; in other words, because of several decades of annual TFRs below 1.5 children per woman and steadily increasing life expectancies, these and other very-low-fertility states are projected to continue to age for the foreseeable future—until old-age mortality dissipates their populations’ currently broad bulges of seniors and middle-agers, and fertility or migration significantly enlarges their childhood and young adult cohorts. In other words, advanced aging is not a momentary inconvenience.

By 2030, advanced aging will have spread widely through Europe (see figure 2: world maps, 2015 and 2030). Current projections by demographers at the US Census Bureau’s International Program Center (International Data Base, June 2011) suggest that the populations of 29 states (each over 1 million residents) will experience a median age over 45.0 years by 2030. Of these, the Census Bureau indicates that 26 will be located in Europe and 3 in East Asia (Japan, Taiwan and South Korea). Despite China’s rapid pace of aging, US Census Bureau projections place its 2030 median age at 43 years, very similar to the UN Population Division’s medium fertility-variant projection for the PRC. The UN Population Division, using a somewhat different set of projection assumptions to produce its medium fertility variant, projects that by 2030 this post-mature group of countries (median age >45.0 years) will consist of 19 states: 14 European, 4 East Asian (including Singapore), and Cuba.

Richard Cincotta is Demographer-in-residence at the Stimson Center in Washington, DC, and a consultant on political demography for the Woodrow Wilson Center’s Environmental Change and Security Program. From 2006-09, he served as a long-range analyst for the (U.S.) National Intelligence Council.